I want to share with you a trading tool that I built in MATLAB. I find it quite useful for backtesting a statistical arbitrage strategy on a particular spread. For example, take the spread 4*FDX-5*UPS. Here it is in Spread Analyzer.
The code takes inputs like entry levels, exit levels, and stop-losses. The output is a graph that looks like this, where the blue line is the level of the spread, the green line is a moving average, and the red line is the cumulative P&L of the strategy:
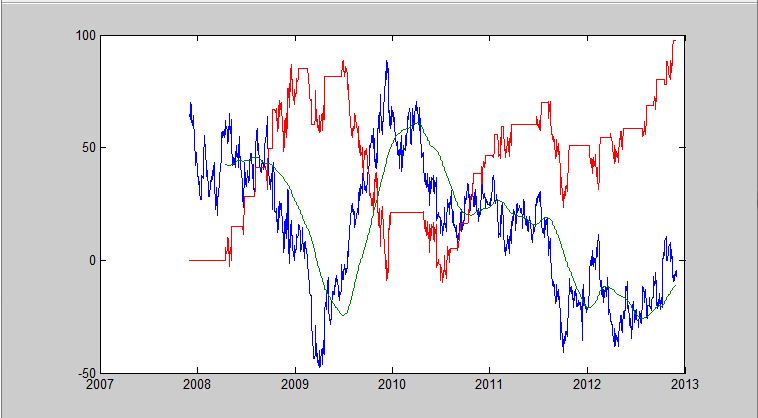
Using this tool allows you to test your parameters to see which entry levels, exit levels, and stop-losses as well as which lookback periods perform the best on each spread. It can also be embedded in a script so you can run it on a portfolio of spreads for the same parameters. This would allow you to analyze your parameters quickly over a larger group of spreads.
What do you think? Would you want to have access to this tool? Anything else you would want this tool to perform?
Written by Jennifer Galperin. Follow me on Twitter and StockTwits