Monday
Feb112013

Trading With Python - Online Course to Boost Your Bottom Line

- Update 4/17/2013. This course has started  and it is closed to new applicants.


Many of you know me as a quantitative trader, blogger, and webinar host.  Some of you know that I studied Engineering at MIT.  I have worked a bit with computer programming and I certainly understand the power of computers to crunch huge amounts of data.

In trading, there are millions of potential trades and many different ways to evaluate each trading opportunity.  Obviously this process can be improved using the data crunching power of computer programming.  Of course, the idea of learning to program can be daunting.  There is a steep learning curve associated with programming.  That is why I am excited for an upcoming course given by fellow Bigger Capital trader and programmer Jev Kuznestov.  Jev’s course is scheduled to start in April, and it will help traders learn programming as applied to quantitative trading.  I have personally worked with Jev on several occasions, and I know he is a smart, experienced programmer who knows his stuff. He is also a great trader.  I plan to attend the course to get up to speed on Python and learn from Jev’s expertise.

The main goal of this course is to help a trader to become a quant. It will teach how to get and process incredible amounts of data, design and backtest strategies and analyze trading performance.

The course gives you maximum impact for your invested time and money.  It focuses on practical application of programming to trading rather than theoretical computer science.  The course provides you with the best tools and practices for quantitative trading research, including functions and scripts written by expert quantitative traders.  The course will pay for itself quickly by saving you time in manual processing of data.  You will spend more time researching your strategy and implementing profitable trades.

The course will span 4 weeks, each week will start with a screencast.  There will be required reading material plus example code (see example here)  for further study. At the end of the week there will be a live online Q&A session. 

Course fee: $350

Course material: Python for Data Analysys by Wes McKinney

Prerequisites:

  • Google account
  • Some basic experience with programming ( if you have no experience at all, this is a good place to start.)

Course outline:

Week 1: Getting started Python: a tool for almost any task Setting up Python environment Python language essentials Dates and times.

Week 2: Data crunching basics Introduction to NumPy (scientific and data analysis tools) Plotting with matplotlib Introduction to Pandas (data analysis package).

Week 3: Managing data Reading and writing CSV files Reading and writing excel files Getting data from the web (Yahoo finance, CBOE) Building a database with SQLite.

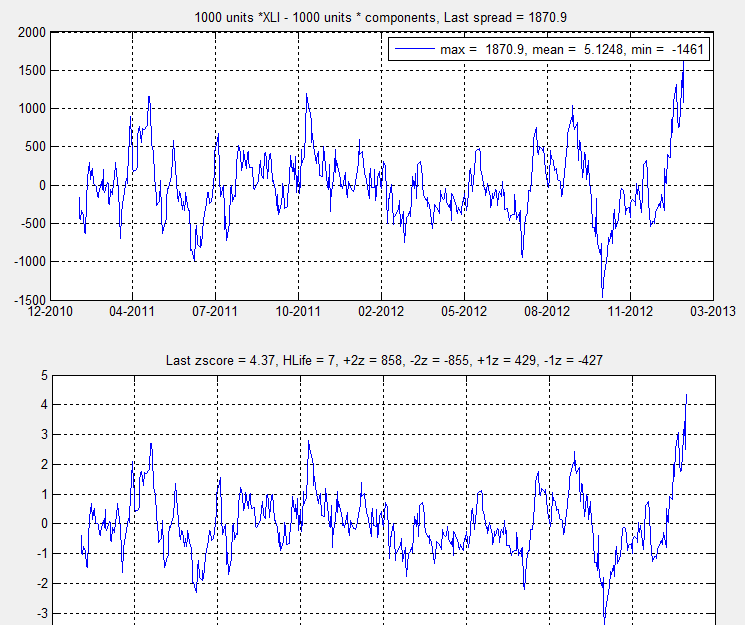
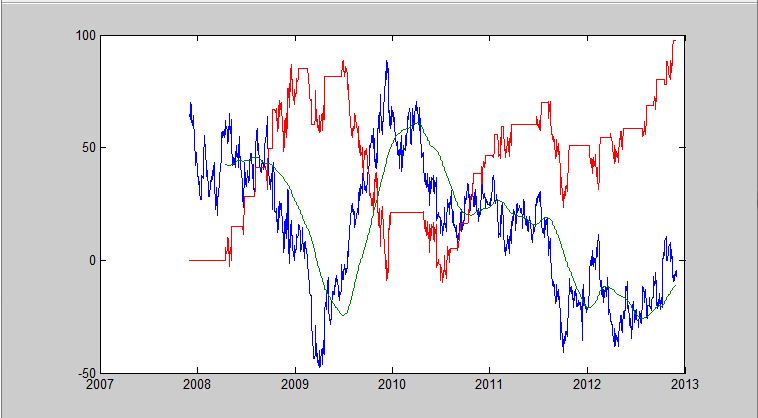
Week 4: Researching trading strategies Backtesting a single instrument (price,position & pnl) Performance measurement: common metrics (sharpe, maxDD) How to build a spread (vxx-vxz example, automatic hedge ratio calculation) Pattern matching example

An example of a screencast demonstrating strategy backtest:


Friday
Feb082013

Beta - Spread Trading Webinar

On Wednesday we held a webinar to discuss the statistical arbitrage trading parameter "Beta".  We had good turnout, and a lot of you requested the replay (at the bottom of this post).  We had some great questions, and I wasn't able to answer them all during the webinar.  One of them in particular I wanted to cover here, because it was quite thoughtful and insightful.  In answering it, I thought about the many interesting ways to look at spread trading.
 
The question was about my selection of spread.  I talked about FDX-UPS, and you can see a chart of the spread here.  This spread is not cointegrating, so the question asked why I had chosen it in a discussion of statistical arbitrage spreads.  I like that spread because the companies are so similar, and I make money trading it when it is statistically cheap or expensive.  I do not worry about the cointegration, because for me the company relationship and the fundamentals are my spring force.  I use the other statistical parameters such as zscore, half-life, and beta in my trading.  
 
The person who asked the question suggested that the 1 year chart showed positive autocorrelation (which to me means it is trending higher).  Betting on mean reversion is fundamentally different from betting on momentum (trends).  Both views can be expressed using spreads.  There is no way to know for sure which way the spread will go in the future.  For this reason, some traders (including me) look at additional factors such as fundamentals or technicals to help predict the future performance.  
 
What do you think of FDX-UPS?  Will it continue to trend higher, or revert back to the mean?  
 
Written by Jennifer Galperin. Follow me on Twitter and StockTwits.
 
Sunday
Feb032013

Trading the Defense Stocks Spike

Last Friday we traded a basket of defense stocks againts the XLI ETF (Industrial Select Sector). The goal is to take advantage of the spread spike displayed on the right side of the upper graph. The upper graph displays the price of 1000 * XLI minus the basket of defense stocks. 
 
The lower graph displays the value of z-score. The last z-score recorded a value of 4.37 which is an extreme deviation away from the mean.
 
We sold the spike!
 
Defense stocks are trading down on an anticipation that defense spending will be cut dramatically. Gene Epstein at Barron's stated in his latest piece not to believe the hype about defense cuts
 
We shall see if he is right or wrong. We view this trade from a purely statistical basis with time and price stops.
 
We have posted the detailed description of the basket in the forum section of our $spread premium product. This is the first time we expose our statistical basket data to the outside world. Dear users let us know what you think. For traders who do not have premium access to our product you can look at spreads between the $XLI and stocks such as $GD, $BA, $NOC and so forth using our spread analyzer.
 
Written by Michael Bigger. Follow me on Twitter and StockTwits.

Thursday
Jan032013

Crossing Wall Street Buy List

I do like to run statistical calculations against list of ideas posted by successful traders or investors. One list that I like quite a bit is the annual buy list at Crossing Wall Street. I ran calculation of the SPY versus each stock spread on our Spread Analyzer.

Here are the results:

SPY vs AFL 

SPY vs BBBY

SPY vs CA

SPY vs BCR

SPY vs DTV

SPY vs FDS

SPY vs FISV

SPY vs F

SPY vs HRS

SPY vs JPM

SPY vs MDT

SPY vs MSFT

SPY vs MOG-A

SPY vs NICK

SPY vs ORCL

SPY vs ROST

SPY vs SYK

SPY vs WFC

SPY vs WXS

My favorite spreads from this set is SPY vs MSFT and CA from a value perspective.

Written by Michael Bigger. Follow me on Twitter and StockTwits.

Friday
Dec072012

How to Make Money Trading Spreads

This past Wednesday we held a webinar about how to make money trading spreads.  Thanks to everyone who joined the webinar.  If you missed it, you can find the replay at the bottom of this post.

The webinar was in response to record numbers of people viewing our Trading Like a Math Geek webinar last month.  Viewers found it interesting, but the majority of questions we got were something like, "Great.  How can I use that to make money?"  

In this month's webinar, we talk about developing your own spread trading strategy.  Spread trading is a very broad topic and generally involves capitalizing on relative movements between connected securities.  Connected can mean a lot of things to a lot of people, but a good way to get started with spread trading is by using the mathematical connections we talked about in the last webinar.  

How do you make money trading spreads?

Written by Jennifer Galperin. Follow me on Twitter and StockTwits


Friday
Dec072012

Two Things I Like About The Avon Spread

I like the amount of potential energy embedded in the 1 * $SPY - 4 * $AVP spread. I also like the $AVP stock price spike that happened this morning.

I am thinking we are about to get a good run in this situation. I am short the spread (short SPY, long AVP) and I am also long the stock outright.

Do you like this spread?

Written by Michael Bigger. Follow me on Twitter and StockTwits.


Thursday
Dec062012

Align Technology In Play Spread

I am watching this in-play spread this morning. I define the spread as 2 * ALGN - 1 * XPH (S&P Pharmaceuticals ETF). You can view this spread within our analyzer here.

Good one? 

Written by Michael Bigger. Follow me on Twitter and StockTwits.


Wednesday
Dec052012

Verifone Spread Gaining Momentum

I think if this 5 * QQQ - 7 * PAY $spread, which is currently trading at $106, trades below $100, we should have the momentum in place to push it down to its average of $70 or much lower. If you look at the chart of QQQ vs PAY (graph at the bottom of the image located below), you can see how much potential energy is embedded in the spread. We are short this $spread.
 
Makes sense? Click here to view this spread in the Spread Analyzer.
 

Written by Michael Bigger. Follow me on Twitter and StockTwits


Saturday
Dec012012

Professional Traders: New Trading Tool

I want to share with you a trading tool that I built in MATLAB.  I find it quite useful for backtesting a statistical arbitrage strategy on a particular spread.  For example, take the spread 4*FDX-5*UPS.  Here it is in Spread Analyzer.

The code takes inputs like entry levels, exit levels, and stop-losses.  The output is a graph that looks like this, where the blue line is the level of the spread, the green line is a moving average, and the red line is the cumulative P&L of the strategy: 

Using this tool allows you to test your parameters to see which entry levels, exit levels, and stop-losses as well as which lookback periods perform the best on each spread.  It can also be embedded in a script so you can run it on a portfolio of spreads for the same parameters.  This would allow you to analyze your parameters quickly over a larger group of spreads.

What do you think?  Would you want to have access to this tool? Anything else you would want this tool to perform?

Written by Jennifer Galperin.  Follow me on Twitter and StockTwits 

Monday
Nov192012

Early Holiday Gift to Our Math Geeks

Thank you to everyone who attended our webinar last week and watched the replay. We had record numbers of viewers, so we know a lot of you are interested in learning more about statistical arbitrage spread trading.  If you are looking at candidates and having trouble finding any that are cointegrated, we are giving out an early holiday gift! Follow this link to find a sample scan with many cointegrated spreads.  In fact, there are so many, you will probably wonder how to narrow down the list.  In that case, here are two videos that will help you identify profitable spread candidates in this scan. Enjoy!
 
Don't forget to send us your candidates on twitter using the "Tweet" button on Spread Analyzer.
 
Here is an updated free scan for 1/11/2013 
 
Michael Bigger (@biggercapital). Follow me on twitter and StockTwits.
Jen Galperin (@slimshappy).  Follow me on twitter and StockTwits.
   
P.S. Here are Jennifer's tweet about her favorite candidates : I tweeted today some of the trading candidates that I found from the scan Michael circulated on the blog. If you are interested, take a look and let me know which ones you like. My favorite is probably $USO $OIL. my candidates