Entries by Jennifer Galperin (17)

Thursday
Apr042013

Harvard Lecture

This week Michael and I will be speaking to a group of students at Harvard University's Introduction to Business and Financial Statistics, taught by Michael Parzen.  We will be showing the class how we use financial statistics to make money trading spreads.  

If you are a student in the class or just want to learn the academic side of spread trading, we suggest you download the presentation and watch the recording (coming soon).  Also, please check out our free scan of cointegrated pairs of US stocks.

Presentation

Stocks Scan

ETFs Scan

Spread Analyzer

Jennifer Galperin.  Follow me on Twitter and Stocktwits.

Michael Bigger. Follow me on Twitter and StockTwits.

Monday
Mar252013

Relative Value in Credit Risk

I think there is a relative value opportunity in credit risk.  I typically focus on equity opportunities but I think this one has the potential to be big enough to branch out to the fixed income asset class.  My background is in equity derivatives, so I understand a little about the market's ability to price risk.  

With long-term risk-free rates at historic lows, investors are taking on increasing amounts of credit risk without being properly compensated.  People need yield and as a result are buying lower quality credits.  This is happening all across the credit curve. Treasury investors are buying high-grade credits, and high-grade credit investors are moving towards high-yield.  Risky credits are bid up relative to less risky credits.  This presents a relative value investment opportunity to buy low-risk credits and sell high-risk credits.  The beauty of this trade is that it has the potential to be profitable in two scenarios: 

Recession.  A recession would keep rates low, but would be a negative in particular for high-yield issuers.  Defaults would scare investors away from high-yield, and investors would move toward high-quality credits. 

Growth.  If the economy shifts into high-gear and inflation picks up, the Fed will raise rates.  When this happens, investors will be able to achieve yield in lower-risk credits.  Investors will slowly pull money back toward investment grade bonds.   

I like this trade because it has the potential to pay off no matter which direction the economy moves. This is the fundamental investment thesis for me in this latest spread trade.  I asked myself some key questions, prior to making the investment:

1.  What should timing be?

2.  What are the risks here?

3.  What is the best vehicle to get involved in this trade?

Timing is critical in any investment.  If you time it wrong you can be sitting on a bad trade for a long time. Even Paulson’s “$15 Billion Dollar Trade” against sub-prime mortgages was in the red before it paid off.  Here, shorting junk bonds has a high cost-of-carry (around 6% per year).  The cost of timing it wrong can be pretty high.

Risks.  The investment is profitable in both bull and bear markets.  The biggest risk is that nothing happens in the market.  In that case I will pay the cost-of-carry for an extended period of time before my trade is profitable.

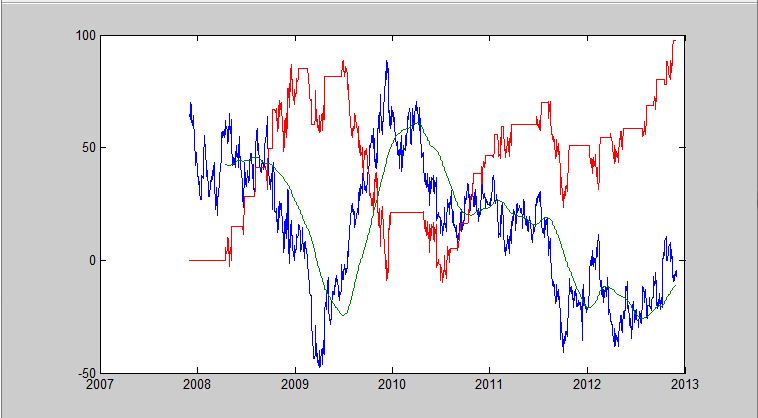
Trading Vehicle.  This is an important question since it impacts my economics significantly.  That said, I am sure there are many vehicles to profit from this opportunity.  I don’t want to bet on specific bonds, but rather the overall market.  With my typical focus on equities, I naturally look to the ETF market.  Specifically, $LQD is an ETF that tracks the performance of the investment grade bond space. $HYG tracks high-yield.  Both are liquid iShares ETF’s with tight bid-offers.  $LQD is yielding around 3% and $HYG around 6%.  With bonds, we trade pairs using the concept of duration-neutral to insulate us from the impacts of interest rate changes.  $LQD has an average duration of 7.7 and HYG 3.9.  Therefore I choose the ratio 1 x 2.  Here is a chart of the spread 1*LQD-2*HYG. As you can see, it tends to spike higher during credit crisis times, and trend lower as rates decline.  Given that $HYG has only been trading since 2007, there is not enough history to see performance during high and low interest rate regimes.

I am monitoring this spread to try to determine a good time to enter the trade long. I am also considering other trading vehicles.  

What do you think of the credit markets?


Written by Jennifer Galperin.  Follow me on Twitter and Stocktwits. 

Monday
Feb112013

Trading With Python - Online Course to Boost Your Bottom Line

- Update 4/17/2013. This course has started  and it is closed to new applicants.


Many of you know me as a quantitative trader, blogger, and webinar host.  Some of you know that I studied Engineering at MIT.  I have worked a bit with computer programming and I certainly understand the power of computers to crunch huge amounts of data.

In trading, there are millions of potential trades and many different ways to evaluate each trading opportunity.  Obviously this process can be improved using the data crunching power of computer programming.  Of course, the idea of learning to program can be daunting.  There is a steep learning curve associated with programming.  That is why I am excited for an upcoming course given by fellow Bigger Capital trader and programmer Jev Kuznestov.  Jev’s course is scheduled to start in April, and it will help traders learn programming as applied to quantitative trading.  I have personally worked with Jev on several occasions, and I know he is a smart, experienced programmer who knows his stuff. He is also a great trader.  I plan to attend the course to get up to speed on Python and learn from Jev’s expertise.

The main goal of this course is to help a trader to become a quant. It will teach how to get and process incredible amounts of data, design and backtest strategies and analyze trading performance.

The course gives you maximum impact for your invested time and money.  It focuses on practical application of programming to trading rather than theoretical computer science.  The course provides you with the best tools and practices for quantitative trading research, including functions and scripts written by expert quantitative traders.  The course will pay for itself quickly by saving you time in manual processing of data.  You will spend more time researching your strategy and implementing profitable trades.

The course will span 4 weeks, each week will start with a screencast.  There will be required reading material plus example code (see example here)  for further study. At the end of the week there will be a live online Q&A session. 

Course fee: $350

Course material: Python for Data Analysys by Wes McKinney

Prerequisites:

  • Google account
  • Some basic experience with programming ( if you have no experience at all, this is a good place to start.)

Course outline:

Week 1: Getting started Python: a tool for almost any task Setting up Python environment Python language essentials Dates and times.

Week 2: Data crunching basics Introduction to NumPy (scientific and data analysis tools) Plotting with matplotlib Introduction to Pandas (data analysis package).

Week 3: Managing data Reading and writing CSV files Reading and writing excel files Getting data from the web (Yahoo finance, CBOE) Building a database with SQLite.

Week 4: Researching trading strategies Backtesting a single instrument (price,position & pnl) Performance measurement: common metrics (sharpe, maxDD) How to build a spread (vxx-vxz example, automatic hedge ratio calculation) Pattern matching example

An example of a screencast demonstrating strategy backtest:


Friday
Dec072012

How to Make Money Trading Spreads

This past Wednesday we held a webinar about how to make money trading spreads.  Thanks to everyone who joined the webinar.  If you missed it, you can find the replay at the bottom of this post.

The webinar was in response to record numbers of people viewing our Trading Like a Math Geek webinar last month.  Viewers found it interesting, but the majority of questions we got were something like, "Great.  How can I use that to make money?"  

In this month's webinar, we talk about developing your own spread trading strategy.  Spread trading is a very broad topic and generally involves capitalizing on relative movements between connected securities.  Connected can mean a lot of things to a lot of people, but a good way to get started with spread trading is by using the mathematical connections we talked about in the last webinar.  

How do you make money trading spreads?

Written by Jennifer Galperin. Follow me on Twitter and StockTwits


Saturday
Dec012012

Professional Traders: New Trading Tool

I want to share with you a trading tool that I built in MATLAB.  I find it quite useful for backtesting a statistical arbitrage strategy on a particular spread.  For example, take the spread 4*FDX-5*UPS.  Here it is in Spread Analyzer.

The code takes inputs like entry levels, exit levels, and stop-losses.  The output is a graph that looks like this, where the blue line is the level of the spread, the green line is a moving average, and the red line is the cumulative P&L of the strategy: 

Using this tool allows you to test your parameters to see which entry levels, exit levels, and stop-losses as well as which lookback periods perform the best on each spread.  It can also be embedded in a script so you can run it on a portfolio of spreads for the same parameters.  This would allow you to analyze your parameters quickly over a larger group of spreads.

What do you think?  Would you want to have access to this tool? Anything else you would want this tool to perform?

Written by Jennifer Galperin.  Follow me on Twitter and StockTwits 

Friday
Nov162012

Trading Like a Math Geek

On Wednesday we held a webinar about Statistical Arbitrage Spread Trading.  We had a lot of people tune in, and there were some great questions.  Thanks to everyone who attended.  If you missed it, you can see the replay at the bottom of this post. 

Statistical Arbitrage spread trading is a way to harness your inner Math Geek to make more money trading.  There are a lot of mathematical concepts, but you can design your trading strategy to be very mathematically strict or just use the mathematics as a framework to exploit relative value opportunities.  It is up to you and your trading style.  In the webinar we discussed the mathematical concepts of cointegration, zscore, and half-life.  We went through a real-life example using the spread 1*BOH - 2*PACW.  You can bring up this spread in Spread Analyzer using this link. You can also look at some of the other spreads we talked about such as FDX and UPS, PEP and KO, or try coming up with some on your own. When you bring them up in Spread Analyzer, hit the "Tweet" button near the top of the output page and include my twitter id @slimshappy so I can see what spreads you are looking at. 

Please send me any feedback or questions on twitter or post them here.  I hope you can attend our next webinar!

Written by Jennifer Galperin.  Follow me on twitter and stocktwits.

Wednesday
Oct242012

The Right Tool for the Job

Any contractor will tell you that you need to have an assortment of tools in your toolbox to get a project done.  Each job requires a specific tool.  When you need a Philips screwdriver, hammer just will not work.  

In trading, each of our strategies is a tool.  Each one works during certain market conditions, but not every strategy can work for every market condition.  Many people are struggling to make money this week because they are using bull market, low volatility strategies.  There is a tendency to try to reinvent the tool, re-work it so it will be effective in all market conditions.  Instead, I think it may be time to put some of those strategies back in the toolbox for the next bull market.  Let's go back to the toolbox in search of some tools for volatile markets.  

For me, when volatility is increasing I find that I need to put on small positions and leave room to add more if levels get worse.  I also find I need to let my winning trades run more.

What trading tools do you use in volatile markets?

Written by Jennifer Galperin.  Follow me onTwitter and StockTwits. 

Friday
Oct052012

Spread Trading Fundamentals

On Wednesday we hosted a webinar about Spread Trading Fundamentals.  Below is the replay of the webinar.  We had great turnout, including lots of first-time attendees.  We talked about how to set up and trade spreads, and we discussed how to use Spread Analyzer.  As I said in the webinar, if you are new to spreads then you have definitely come to the right place.  

Spreads (or pairs) can really help you visualize arbitrage opportunities where one stock is trading cheap and another is trading expensive on a relative basis, as I discussed in my CMS-DTE example in the webinar.  Our goal is to make it as easy as possible for you to trade spreads by providing all the tools you need for finding, tracking, and recording your spreads.  Whether you are new to spread trading or experienced, we have tools that can help you.  

If you want more information about Spread Trading, please explore our site.  Our How to Trade Spreads handbook is extremely useful to find out more about everything from spread trading fundamentals to more advanced topics like statistical arbitrage, cockroach theory, and more.  Please click on SpreadTraderPro to find out more about SpreadTraderPro and the handbook. 

Please stay tuned for more Spread Trading webinars, including an exclusive bonus webinar later this month for SpreadTraderPro members only!  Our next general webinar will be in early November.


Written by Jennifer Galperin.  Follow me on Twitter and StockTwits

Friday
Sep072012

My Little Tricks for Profitable Spread Trading Webinar

On Wednesday we hosted a webinar where I talked about my little tricks for profitable spread trading.  We had a great group.  If you missed it, you can see the replay at the bottom of this post.

My favorite little trick is to combine two different types of metrics for finding good candidates.  We went through the example of statistical metrics + fundamental metrics.  I want to hear if you are trying this type of trading strategy, and how you are making it work for you.  Please feel free to comment here to this post or send me feedback on twitter.


Produced and written by Jennifer Galperin.  Follow me on twitter and StockTwits.  


Thursday
May172012

Parameters of Statistical Arbitrage Spread Trading  Webinar

This past Wednesday we held a webinar about the parameters for statistical arbitrage spread trading. We had a great audience, and many people have written me separately to ask about a replay.  You can find the replay at the bottom of this blog post.  

One thing that always surprises me about spread trading is how many different ways there are to look at it.  Even within statistical arbitrage, you might think that computers can choose the spreads and trade the strategy without human input.  But the old saying "garbage in, garbage out" holds true here too.  The trader has to design a strategy to select spreads based on the parameters.  There can be as many different strategies as there are traders, because each trader takes a slightly different view on the input parameters.

In the webinar, we talked about the significance of cointegration, half-life, zscore, and term.  I talked a little bit about how my strategy views these parameters, and I am interested to hear how your strategy is designed.  Please feel free to comment about that, or leave feedback about the webinar.  

Here is the webinar replay:


We hope you will join us next month for the next webinar in the series.


Written by Jennifer Galperin. Follow me on Twitter and on StockTwits