
Friday
Jun252010
The Volatility Optical Illusion
 Michael Bigger
Written by Michael Bigger. Follow me on Twitter.
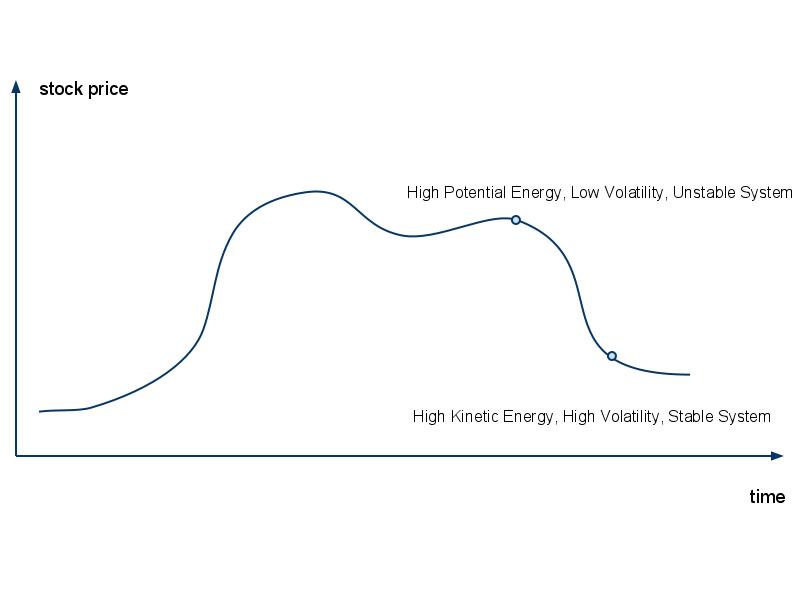
The stock market is a great optical illusion. When prices march much higher, volatility decreases but instability in the system increases. The opposite is true after a big fall. Volatility is high but stability increases.
These statements lead us to state the following dualities:
- Perceived instability is stable.
- Perceived stability is unstable.
What are some of the signs we believe indicate instability?
- Low implied volatility.
- A P/E ratio much higher than historical levels.
- Lower than typical implied options correlation.
- A decline in dividend yield.
- Your cab driver is talking about stocks.
What are some of the signs indicating a stable market?
- High implied volatility.
- P/E ratios comparable to or lower than historical levels.
- High implied options correlation.
- An increase in dividend yield.
- Panic in the market.
We have been fooled many times by Mr. Market. Have you?
Reader Comments (3)
Stable is the last thing i'd call 2008, when the VIX was in the 50-70 range.
I'd say that perceived instability is stable...eventually.
Exactly.Eventually the kinetic energy dissipates.
An unstable stock market like we had in 2006 was non volatile. Stability refers to the amount of potential energy in the system.