Thursday
Aug082013

Pay Attention to Cal-Dive 

Some thoughts I wrote down about Cal-Dive on 7/11/2013 

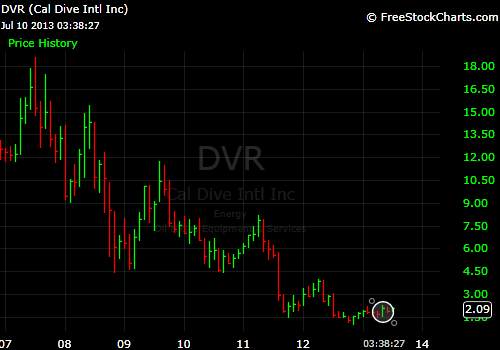
We are paying attention to the price action of Cal-Dive ($DVR). I am liking the spike I am seeing on the $DVR chart. There is a ton of value in this situation and the present set up reminds me of Avon ($AVP) and Nutrisystem ($NTRI). I wrote about Avon right here and Nutrisystem here.


There is a ton of potential energy in the $SPY/$DVR spread. We are long the spread.

Written by Michael Bigger. Follow me on Twitter and StockTwits.

The information in this blog post represents my own opinions and does not contain a recommendation for any particular security or investment. I and my affiliates hold positions or other interests in securities mentioned in the Blog.

Tuesday
Jul022013

Zynga - Note to Self

I am liking the spike I am seeing on the Zynga ($ZNGA) chart. There is a ton of value in this situation and the present set up reminds me of Avon ($AVP) and Nutrisystem ($NTRI). I wrote about Avon right here and Nutrisystem here.

There is a ton of potential energy in the $SKYY/$ZNGA spread.


Written by Michael Bigger. Follow me on Twitter and StockTwits.

Thursday
Jun272013

How to Use Our Spread Analyzer Split Engine

Sunday
Jun162013

Scan All: Simple Tool for Hedging Short-Term Trades

Scan All is a simple tool to help you hedge short-term trades. Check out how it works by watching our quick video or reading the summary below the video:

If you are a short term trader, you know that markets move fast.  When you see an opportunity to get into a trade, you need to get in quickly.  Once you are in a trade, you need to manage the risks of the trade quickly as well.  

Let’s say your position quickly moves in your favor, but it is still not quite at your target exit level.  Some traders will look for opportunities to move up their stop-loss.  The problem there, of course, is that you may get stopped out too soon.  Another solution is to find a way to reduce the risk using a hedge.  A good hedge for a long position would be a short position in a stock that tends to trade similarly to your stock.  How do you find such a stock?  That is where our Analyzer comes in.  

Simply go to biggercapital.com/Spread-analyzer, log in, and click on “Scan All” at the top on the right.  Type in your trading position and click on the different tabs to look at different databases.  My Queries will show you pairs you have viewed in the past containing your stock.  Ranked Spreads is a crowdsourced database of other users’ queries containing your stock, along with a rating for each spread.  And Cloudscan is our statistical arbitrage database showing pairs containing your stock.  Each of these tabs can show you potential pairs that will trade similarly to your stock.  

For example, let's say you had just bought GMCR for a short-term swing trade.  If you click on Ranked Spreads, it looks like the most highly rated and most often viewed pairing is DMND.  Click the “View Query” link to see more information about this pair.  If the two stocks trade together pretty well from a mathematical standpoint, short position in DMND could serve as a good hedge for a long position in GMCR.  Entering this short position means you have reduced some of the risks in your long position, and that can allow you more flexibility in managing your profit targets and stop-losses.  

Next time you are working with a short-term trading position, check out our “Scan All” feature to see how easy it is to reduce risk using this quick and easy trading tool.


Written by Michael Bigger. Follow me on Twitter and StockTwits.

Tuesday
Apr302013

What Is a Spread LSR Alert?

An LSR alert will fire if the most-recent $spread price is outside the boundary created by multiplying the standard deviation of the price series with the supplied "standard deviation multiplier", and then adding or subtracting the least squares regression value at the same point in time.

The Spread Analyzer provides the customers with the ability to create 3 of these alert for each spread.

Written by Michael Bigger. Follow me on Twitter and StockTwits.

Saturday
Apr272013

How to Use the Spread Analyzer

Jennifer produced a new video on How to use the Spread Analyzer. In the next few weeks we will add more videos on how to use all the new features we have introduced in the new version of the Spread Analyzer we released this week. Stay tuned!


Jennifer Galperin.  Follow me on Twitter and Stocktwits.

Aris David. Follow me on Twitter and Stocktwits.

Michael Bigger. Follow me on Twitter and StockTwits.

Thursday
Apr042013

Harvard Lecture

This week Michael and I will be speaking to a group of students at Harvard University's Introduction to Business and Financial Statistics, taught by Michael Parzen.  We will be showing the class how we use financial statistics to make money trading spreads.  

If you are a student in the class or just want to learn the academic side of spread trading, we suggest you download the presentation and watch the recording (coming soon).  Also, please check out our free scan of cointegrated pairs of US stocks.

Presentation

Stocks Scan

ETFs Scan

Spread Analyzer

Jennifer Galperin.  Follow me on Twitter and Stocktwits.

Michael Bigger. Follow me on Twitter and StockTwits.

Monday
Mar252013

Relative Value in Credit Risk

I think there is a relative value opportunity in credit risk.  I typically focus on equity opportunities but I think this one has the potential to be big enough to branch out to the fixed income asset class.  My background is in equity derivatives, so I understand a little about the market's ability to price risk.  

With long-term risk-free rates at historic lows, investors are taking on increasing amounts of credit risk without being properly compensated.  People need yield and as a result are buying lower quality credits.  This is happening all across the credit curve. Treasury investors are buying high-grade credits, and high-grade credit investors are moving towards high-yield.  Risky credits are bid up relative to less risky credits.  This presents a relative value investment opportunity to buy low-risk credits and sell high-risk credits.  The beauty of this trade is that it has the potential to be profitable in two scenarios: 

Recession.  A recession would keep rates low, but would be a negative in particular for high-yield issuers.  Defaults would scare investors away from high-yield, and investors would move toward high-quality credits. 

Growth.  If the economy shifts into high-gear and inflation picks up, the Fed will raise rates.  When this happens, investors will be able to achieve yield in lower-risk credits.  Investors will slowly pull money back toward investment grade bonds.   

I like this trade because it has the potential to pay off no matter which direction the economy moves. This is the fundamental investment thesis for me in this latest spread trade.  I asked myself some key questions, prior to making the investment:

1.  What should timing be?

2.  What are the risks here?

3.  What is the best vehicle to get involved in this trade?

Timing is critical in any investment.  If you time it wrong you can be sitting on a bad trade for a long time. Even Paulson’s “$15 Billion Dollar Trade” against sub-prime mortgages was in the red before it paid off.  Here, shorting junk bonds has a high cost-of-carry (around 6% per year).  The cost of timing it wrong can be pretty high.

Risks.  The investment is profitable in both bull and bear markets.  The biggest risk is that nothing happens in the market.  In that case I will pay the cost-of-carry for an extended period of time before my trade is profitable.

Trading Vehicle.  This is an important question since it impacts my economics significantly.  That said, I am sure there are many vehicles to profit from this opportunity.  I don’t want to bet on specific bonds, but rather the overall market.  With my typical focus on equities, I naturally look to the ETF market.  Specifically, $LQD is an ETF that tracks the performance of the investment grade bond space. $HYG tracks high-yield.  Both are liquid iShares ETF’s with tight bid-offers.  $LQD is yielding around 3% and $HYG around 6%.  With bonds, we trade pairs using the concept of duration-neutral to insulate us from the impacts of interest rate changes.  $LQD has an average duration of 7.7 and HYG 3.9.  Therefore I choose the ratio 1 x 2.  Here is a chart of the spread 1*LQD-2*HYG. As you can see, it tends to spike higher during credit crisis times, and trend lower as rates decline.  Given that $HYG has only been trading since 2007, there is not enough history to see performance during high and low interest rate regimes.

I am monitoring this spread to try to determine a good time to enter the trade long. I am also considering other trading vehicles.  

What do you think of the credit markets?


Written by Jennifer Galperin.  Follow me on Twitter and Stocktwits. 

Friday
Mar152013

NutriSystem - Note to Self

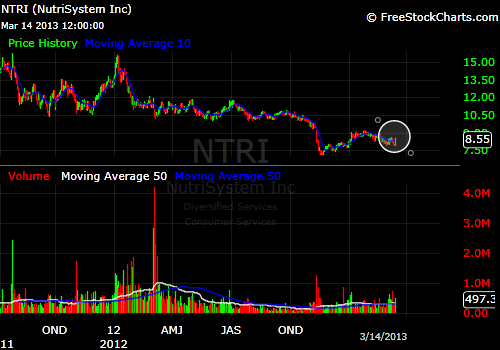
I am liking the spike I am seeing on the Nutrisystem ($NTRI) chart. There is a ton of value in this situation and the present set up reminds me oF Avon ($AVP). I wrote about Avon right here.

There is a ton of potential energy in the SPY/NTRI spread.

Written by Michael Bigger. Follow me on Twitter and StockTwits.


Tuesday
Mar122013

Cool Video About Basket Trading

Aris David recently sent me this video about basket trading. I think Shawn Cooke did great work in producing this video. For some reasons, his site insidethetrade.net is out of commision. If you know Shawn, let him know that I would love to talk to him. Enjoy this great video!
   
Written by Michael Bigger. Follow me on Twitter and StockTwits.