Friday
Jun122015

LD Micro Invitational Conference

Many thanks to the team at LD Micro for organizing a great conference!  In particular, Chris Lahiji did an amazing job bringing so many great companies and investors together.  Conrad and Wade organized the 1x1 meetings and dealt with lots of changes to the schedule.  In addition to connecting with companies, I was able to network with a great group of smart investors. 

At the conference, I had the good fortune to connect with about 20 great companies.  Of those, here are the ones I plan to keep on my radar for the near-term: 

Iveda (IVDA): Market Cap $27mm.  

Iveda is in the cloud-based video surveillance market.  Specifically, Iveda generates monthly recurring revenues by offering customers wifi-enabled security cameras marketed through ISP’s.  Initial sales successes have been through telecom companies in the Philipines and Vietnam, with Mexico coming online in the third quarter.  The cameras themselves are somewhat of a commodity product (low-margin) but they are easy to deliver to the end user (drop-ship from the manufacturer) and easy for the end user to set up (wifi-enabled).  The real value and money is in the software to access the video feed (and, for an additional fee, save video for pre-determined lengths of time).  Note that the ISPs provide the hosting and storage, Iveda provides the software to link the cameras to the data and storage.  Iveda has about $2.6mm in cash on the balance sheet, with $1mm of it restricted related to a specific purchase order from a large customer.  Cash burn is currently about $275k / month, with sales successes expected to drive revenues such that cash flow will be positive by year end.  In the first quarter of this year, Iveda closed a $3.1mm Series B convert with investors, including a strategic investor. We are monitoring and might get involved if the company gets a bigger strategic investment or if some US ISP’s express an interest. 

Calpian (CLPI): Market Cap $25mm, Total Debt $19mm

Calpian is in the mobile payments business.  Their largest subsidiary, MoneyOnMobile (72.9% owned by CLPI, with options to buy another 1.1%) operates in India.  Of India’s 1.2 billion people, about half of them have no access to electronic payments or bank accounts.  Calpian is building infrastructure there to enable people with no bank or smartphone to digitize cash for easier payments.  Customers deposit cash at a local bodega and can digitally pay bills including phone, utilities, and TV.  Previously, customers needing to pay bills would need to travel (sometimes quite far) to a centralized location where they might wait hours to pay their bills.  Using MoneyOnMobile’s transaction-based bank, customers pay a fee on the order of 1% to 5% but avoid the cost and inconvenience of paying these bills with cash.  MoneyOnMobile currently has about 260,000 retail locations and about 131mm cumulative unique users on the system, with about 4mm “Repeat Active” users as of April 2015.  Monthly average transactions is about 7mm, with about Rs 2Bn (a little over $30mm US) processed in April 2015.  Average transaction volume has been increasing, as well as transactions / user.  MoneyOnMobile reported $57mm in top-line revenues in 2014, with gross margins of about 1%.  We are monitoring the situation. 

Chanticleer Holdings (HOTR): Market Cap $40mm.

Chanticleer is best described as a publicly traded private equity company in the restaurant operations business.  The company primarily focuses on the fast casual arena.  Their flagship holding is the corporate parent company Hooters, although there are discussions around selling this parent company to pay off the debt associated with it.  Chanticleer also owns 14 international Hooters franchises (mostly in South Africa and Australia).  They also own several local high-end burger franchises and chains, including American Burger, BGR, and are under LOI to buy BT’s Burger Joint.  They bought a significant share in Just Fresh out of a distressed situation.  In January Chanticleer raised about $8mm, mostly through friends and family.  The growth strategy involves buying existing restaurants for about 5x or less multiple of EBITDA.  Chanticleer continues to operate portfolio chains under their heritage name, but consolidates some operational line items such as beverage contracts and insurance.  One thing to note is that there are significant warrants outstanding.  We are monitoring the situation. 

Spiral Toys (STOY):  Market Cap $20mm, almost no debt.  

Spiral Toys uses consumer products as a bridge to digital content.  Their first area of focus is CloudPets, which is a stuffed animal that connects using bluetooth to phones to provide digital content.  On this product, they are partnering with Disney, Wal-Mart, NickJr, and Google.  This product launches this fall.  The company only went public in March of this year.  We are monitoring the product launches to see if they gain traction with the consumer. 

Quest Solutions (QUES): Market Cap $10mm.

Quest provides hardware and software solutions for logistics management.  They add value to small and medium-sized businesses by designing and implementing systems to improve efficiency.  An example would be a bakery that provides buns for fast-food chains.  Their hardware and software can allow the bakery to track the usage of the buns to deliver new, fresh product when supply is getting low.  Quest provides hardware (tracking RF chips) and software, so there is upfront revenue as well as ongoing.  The sales cycle is relatively long (6 months or so) but it is very collaborative and the revenue is sticky.  In the last 3 years, only 3 of 90 customers have failed to renew service contracts.  There are about 5 competitors that offer a full suite of products, but all (including QUES) are resellers of hardware.  For example, they may purchase tablets from Dell or Apple and upgrade the case for durability, add a swivel arm or forklift mounting device, or make other modifications.  QUES uses their relationships with hardware manufacturers to improve the economics for both QUES and their customers.  They recently acquired two companies, one in November and another closing soon.  2014 Pro-Forma revenue for both acquisitions was $60mm with $2.2mm EBITDA.  We are monitoring growth as well as integration of the acquisitions. 

IronClad (ICPW): Market Cap $20mm

IronClad designs and sells performance gloves.  Their primary market is workers on oil & gas rigs, although they have lines of gloves for many professional and recreational markets (think everything from home repairs and gardening to snowboarding and motocross).  They sell through distributors like Grainger.  In February 2014 they got a new management team, after the old management team tried and failed at selling the company.  At that time, they moved from CA to TX to be closer to their major customers.  They took 6 of 20 people from that location, and they are building their sales team.  The new CEO ran a $100mm company and wants to grow the business substantially.  They have signed over 300 retail doors such as Dicks Sporting Goods, Ace and True Value and Bunnings Australia.  Revenues are about $24mm with gross margins about 30% to 35%.  The market cap is quite low for the relationships they have, but need to see some catalysts shaping up for us to get interested.

SMTP (SMTP): Market Cap $35mm

SMTP is in the marketing automation business.  The company began as an email delivery company.  In the last six months or so they made 2 significant acquisitions, GraphicMail and SharpSpring.  GraphicMail is basically a competitor to MailChimp, for graphic newsletters and other email campaigns, but with a global sales team (based in 14 countries) that speaks multiple languages.  GraphicMail is relatively stable, cash flow positive business.  SharpSpring is the real growth potential because it is in Marketing Automation, a $3Bn and growing market segment.  Marketing automation is highly competitive, with major competitors Marketo and Hubspot each valued at over $1Bn in market cap and spending about $100mm / year in sales & marketing.  Sharpspring has some unique features such as call tracking and CRM integration which appeal to customers.  In addition, SMTP is employing a unique marketing strategy.  They target marketing agencies (rather than end users directly) to quickly expand its reach to end-users.  In addition, SMTP believes SharpSpring will benefit from the huge marketing spend of competition to drive awareness of the sector.  Marketing Automation is “sticky” with only about 2% attrition so far on average, since customers get comfortable with the interface and can access historical information.  Competition has higher attrition rates, but SMTP believes most users leave for a lower-cost solution (such as SharpSpring).  SharpSpring sits in a unique place within marketing automation since it is priced at significantly less than major competitors while including additional features such as CRM and call tracking.  For this reason, it can appeal to a larger number of companies who can’t afford the standalone solutions or the salaries of employees to manage these solutions.  SMTP has a clean balance sheet with no debt and about $13mm in revenue, $1.3mm EBITDA in fiscal 2014.  Need to see significant traction with agencies with consistent low attrition rates for us to get involved.   

LiquidMetal Technologies (LQMT): Market Cap $60mm

Liquidmetal manufactures small, complex injection-molded metal parts with 3D precision that resist corrosion and are extremely strong. These products are desirable for several industries including consumer electronics, watches, and medical devices.  For several years, Apple paid upfront several years ago for a non-royalty license to use the technology in Consumer Electronics. In addition, Swatch has a royalty license to use it for watches.  The company recently hired Paul Hauck as VP of Sales & Marketing with experience in injection-molded metals.  Paul is building and training a commission-based sales team with extensive experience in medical devices.  The sales cycle can be quite long (6-9 months).  In addition, the company completed construction of a manufacturing facility in CA back in October 2014.  LQMT has relationships with feedstock suppliers and manufacturers of the injection molding equipment necessary to manufacture parts using LQMT’s technology.  The company has $8.2mm in cash with $3.9mm in liabilities.  In addition, they have a $30mm undrawn equity line of credit with Aspire Capital with a floor of $0.10 on the stock.  Need to see traction (sales) in medical devices for us to get involved. 

Telenav (TNAV): Market Cap $350mm.

Telenav makes navigation software.  They have been working with Ford since 2010, and just acquired GM as a customer.  The 2017 requirement that all new cars have backup cameras will be a tailwind for them because the option to install navigation software will be partially offset by the mandatory presence of a color screen.  In 2014 they did about $150mm in top-line at about 60% gross margins.  It has almost doubled in the last year, and we think upside potential is 2x at most.  At this market cap, this company is too rich for our blood. 

Microvision (MVIS): Market Cap $150mm.

Microvision makes tiny laser projecting hardware components.  They sell to consumer electronics companies who package the components into a product with a power supply, speakers, controls, etc.  The projector doesn’t need to be focused and can project small to large format fairly easily.  They have about $18mm in orders to date with SONY and are working with an OEM to fit their product into a smartphone.  Currently manufacturing at negative margins, but if they can get sales from $4mm to $50mm they forecast break-even on a gross basis.  Current cash position is $16.7mm with a burn of about $1mm / month.   

S&W Seed Company (SANW): Market Cap $65mm.

S&W Seed Co is a breeder and grower of two main crops, Alfalfa and Stevia.  Alfalfa is the 4th largest (by volume) crop in the world, primarily as a feed crop for animals.  SANW has about 20% market share in this crop and this is the stable, slow-growth business.  Stevia is somewhat new to the market and has a huge growth potential, although unclear which companies will benefit tremendously from its growth.  In the Stevia market, SANW is focused on upstream breeding, and has 2 patents on stevia seeds.  

Of interest: RMG Networks (RMGN) Investment Thesis

Jennifer Galperin. Follow me on Twitter and Stocktwits.

Michael Bigger. Follow me on Twitter and StockTwits

Disclaimer: We have no position in any of the companies mentioned in this article as of 6/12/2015. 

Friday
May222015

PLUG PowerTrip Notes

On May 19, PLUG hosted the first of six presentations on it's PowerTrip tour.  The focus of this presentation was on sales growth and margin improvements.

CEO Andy Marsh announced a new big box retail customer with 1 site (177 GenDrive units) fully deployed as of early May.  This customer has over 100 distribution centers in the US, and could easily become a regular customer.  Andy reiterated confidence in 2015 guidance, which stands at $100mm in revenue and $200mm in bookings.  To get to $200mm in bookings: 

  • $46mm already booked as of the end of the first quarter.  
  • $113mm in business from existing customers at > 90% probability, including about 8-10 WMT sites in 2015.  
  • $208mm in near-term opportunities, of which they only need to convert about 25% to meet plan. 

Andy then discussed his medium-term plan, which I found very interesting.  Andy sees an addressable market for PLUG of about $5bn annually.  He sees $500mm in annual revenues as the goal for 3-5 years out, broken out as follows: 

  • $260mm from GenDrive units sold to present customers.
  • $100mm from selling H2, infrastructure, and service sold to present customers.
  • $80mm from new accounts. (this sounds low to me, but conservative is good)
  • $60mm in international sales.

Critical to PLUG's success is the infrastructure to deliver H2 where it is needed.  Currently, each site has a liquid storage tank for H2 which receives deliveries about once a week.  This tank supplies the refilling stations located inside the center.  Given the high cost of the H2 storage tank and related equipment (about $1mm give or take), the change to PLUG GenDrive from lead-acid batteries only makes sense for "larger" distribution centers (>about 50 trucks).  For smaller centers, H2 would need to be more accessible without on-site storage and infrastructure.  Similarly, applications that require significantly more H2 (such as refrigeration TRUs) would require better infrastructure to avoid daily (or more often) refilling of the liquid tanks.  So Andy is very focused on H2 not only as a potential product, but as a way to make PLUG products more accessible to a wider range of customers and applications. 

After Andy gave the update, COO Keith Schmid spoke in depth about goals for gross margins for the balance of 2015 and beyond.

Keith targets about 29% gross margins by the fourth quarter of 2015 for the GenDrive product (the cornerstone of the GenKey product suite).  He plans to achieve this goal with several key initiatives:

1.  Design improvements.  Each generation of GenDrive products includes improvements in functionality as well as reductions in cost to manufacture.  By replacing costly parts (or those parts that take extensive time to install), manufacturing costs can be reduced.  The next major design changes will hit market during the third quarter of this year.

2.  Volume.  With increasing sales, obviously PLUG can spread fixed costs over a larger number of units.  In addition, though, PLUG gains leverage with suppliers for longer runs and better pricing.  In addition, PLUG gains flexibility to use custom-made parts previously unavailable for smaller volumes.  All in all, higher volumes have tremendous effects on reducing costs and improving gross margins.

For the rest of the product suite, which includes GenFuel and GenCare, Keith and team plan for positive gross margins by the end of the year.  To get there, volume is critical to achieve economies of scale.  In addition, drastic improvements in diagnostic software mean technicans can get units back up and running quickly, with minimal need to escalate issues.

On a long-term basis, Keith thinks 30% + gross margins are possible across the board, with SG&A at around 20% of sales, for a net EBITDA margin number of 10% to approaching 20%.  

If we put Andy's $500mm 3-5 year plan together with Keith's 10% + EBITDA targets, here is where we see valuation:

$500mm revenue

$100mm EBITDA

$1Bn EV at 10x EV / EBITDA

$131mm cash on the B/S as of 3/2015, with $0 debt

Potential Market Cap: $1,131mm, or $6.54 / share.  

Of interest: Plug Power Site Visit

Jennifer Galperin. Follow me on Twitter and Stocktwits.

Michael Bigger. Follow me on Twitter and StockTwits

Disclaimer: Plug Power has never made any money. Take our opinions with a grain of salt.

Friday
May152015

COSI Conference Call Notes 5/14/2015

Some notes from the call: 

  • Refreshes will be completed by 2016 Q1.
  • 3 components to refreshes: Physical, efficiencies, Hearthstone leverage.
  • Early indication...double digit comp growth after a full refresh.
  • Hearthstone merger will contribute $2.4mm in incremental cash flow to COSI in 2015.
  • They will remodel 55 of the 64 stores.
  • Cash flow + target in Q4 2014 intact.
  • Fully diluted # shares 47.805399mm shares.
  • No more capital raise needed.
  • Menu refresh should be complete by end of May. 
  • Menu count should drop by 25%.
  • From that base they will experiment with new additions and substractions.
  • New entrants into fast casual space not causing real concerns because fast casual is such a small piece of the overall pie however it makes acquiring real estate much harder.
  • Both traffic and average check size increased in the first quarter.
  • All three cost categories (food, labor, and occupancy) went up in the first quarter.  This is disappointing.  We have written about the need to cut labor and occupancy costs, and we are looking for signs that these costs are turning.  RJ indicated that this is happening in Q2.
  • RJ is getting things in place that have been long neglected: Management team, technology.

Of interest: Cosi Investment Thesis

Jennifer Galperin. Follow me on Twitter and Stocktwits.

Michael Bigger. Follow me on Twitter and StockTwits

Thursday
Apr162015

Updated Investment Thesis: Cosi

This post was amended on May 5th, 2015 to correct a mistake we made about the level of Hearthstone indebtness on the acquisition date. We increased the amount of debt by about $6 million. 

Price: $2.72 (4/14/2015)

Enterprise Value: $107mm

Debt: $12.6mm

Cash: $29.3mm calculated as:

  • $21.6mm on the balance sheet as of 12/29/14

  • + $10.8mm ($15.5mm Cash Proceeds from Secondary, less $4.7mm Debt Paydown)

  • - $3 mm burned in Q1

Shares Outstanding: 47.8mm


cosi chart 4 15 2015.gif


Summary

  • We project a goal of $14.5mm in annualized EBITDA in the medium term based on improved revenues and gross margins.  

  • We believe COSI has medium-term upside to $4.30.  The stock price could get to $6.27 using metrics closer to the Hearthstone metrics for the overall system.  


Background

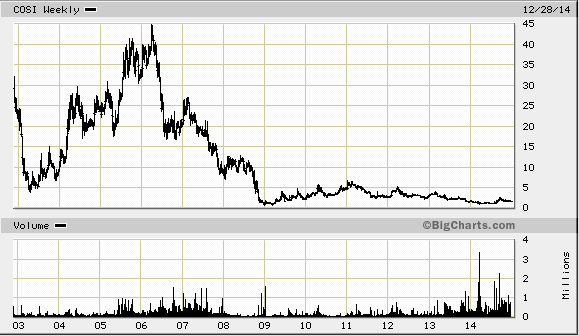
COSI Restaurants is a brand that resonates with many busy office workers in cities like New York and Boston.  The food is good, the bread is fresh, and it smells fantastic.  But management has struggled to grow the company profitably, and the stock has declined dramatically since its peak of about $45 in 2006.  We have been following the company for quite a while, looking for an opportunity when a turnaround might be imminent.  

We first started blogging about COSI in June of last year, shortly after RJ Dourney took over as CEO in March of 2014. It took no time to convince ourselves we were on to something and we started buying the stock at about $1.10 and have since increased our position at much higher prices.

RJ is a veteran of the restaurant industry with experience growing Applebees and Chili’s, and turning around Au Bon Pain.  Dourney began his relationship with COSI in 2005 as a franchisee and quickly developed a formula for operating his restaurants successfully.  His company, Hearthstone, grew from 5 to 13 profitable locations in and around Boston by 2014. This is quite an accomplishment since the parent company has accumulated more than $300mm in net negative earnings over its lifetime.  So when Dourney took the reins at COSI, we knew we needed to meet him.  After literally stumbling and breaking my leg, I finally organized the trip in August 2014, the day after Janus bought 20% of the company.  We think RJ is the right leader to turnaround the fortunes of COSI at the corporate level and turn it into the next PNRA or CMG.  With Janus on the shareholder list, our conviction got even stronger.

Market

Cosi operates in the fast casual dining market. This is a great space for two reasons.  First, fast casual is a growing area filling the void between low-quality fast food and higher quality restaurants that require a full hour for lunch.  At Cosi (and competitors Panera and Chipolte, to name a few), customers can get a delicious lunch in just a few minutes. Second, Americans are moving toward high-quality, healthy food. Cosi makes all its bread in-store, which means the bread contains simple ingredients and tastes fresh.  Most people could eat at Cosi almost 5 days a week due to the large variety of healthy menu options.  Check out this video to see what we mean: youtu.be/-A0eG0s2x9Q.  

So, we establish that Cosi has a great brand with an experienced, motivated management team in place and a business model that is proven in Boston.  The task ahead is to implement the model system-wide and, once the company is profitable, to gain operational leverage by expanding the number of restaurants.  

Financials - Updated as of 12/29/2014 - 10K Filing

COSI has 64 company-owned locations (58%) and 47 franchises locations, for a total of 111 restaurants.  Here is a breakdown of revenues and costs for the company-owned stores:


Cosi 2014


Cosi 2013


Cosi 2012


$mm

% of revenues


$mm

% of revenues


$mm

% of revenues

Revenue

75


83


95


Food Costs

20.1

26.80%


21

25.30%


22

23.16%

Labor

29

38.67%


32

38.55%


34

35.79%

Occupancy

27.7

36.93%


29

34.94%


30

31.58%


Gross Profit

-1.80

-2.40%


1

1.20%


9

9.47%


A few things are interesting about the numbers, and in particular the trends.  To state the obvious, revenues have been declining.  In our view, this is merely a statement of the problem.  Poor management and limited capital investment have led to significant deterioration of the culture, physical stores and brand image.  

In addition, COSI has steadily been closing stores.  COSI began 2012 with 80 company-owned stores.  By the beginning of 2013, that was 75 stores, and by the beginning of 2014 just 70 stores.  At the end of 2014 there were only 64 company-owned stores, or 80% of the January 2012 store count.  So a 21% decrease in company-owned store revenue is not surprising given the 20% decrease in store count.  But we think there is a ton of potential to increase improve the culture at the employee level, refresh the stores, and restore what is truly a great brand.   

When Dourney took over Au Bon pain in 2000 the AUV was $1.1mm and 5 years later it reached $1.7million. In our previous post, we discussed how each of RJ’s Boston franchise stores are generating about $1.75mm in AUV.  Currently the company-owned stores are generating about $1.2mm in AUV.  If he and his team can successfully implement the Hearthstone formula system-wide, even at $1.6mm AUV * 64 company-owned restaurants =  $102mm in top-line revenues.  We don’t expect this to happen overnight, but with patience we expect current Cosi restaurants to reach this goal.  Add to that the 15 Hearthstone restaurants, of which 13 are standalone locations (2 are kiosks) at current $1.75mm AUV per standalone location for a contribution of $23mm to top-line.  So total potential of $125mm revenue from company stores system-wide. Moving over to the costs, we see an increase in all 3 cost categories as a percentage of sales from 2012 to 2014.  Food Costs, Labor Costs, and Occupancy cost (in %) all increased during the time period.  In order to be profitable, these costs will need to decrease as a percent of revenues.  Now, 2014 really was a transitional year for COSI.  RJ Dourney made a lot of changes to the team, culture, and systems.  Change is never without friction, so we expect costs to go up temporarily as part of the transition.  Based on RJ’s comments in presentations and earnings calls, it seems he feels much better positioned in early 2015 for success.  So we will be very focused on the cost components to see if we start to see an inflection point where they start to move down.  

In our previous post, we discussed our medium- to long-term targets for each of these cost categories in percentage terms and our reasoning behind those targets.  We think food costs should come down slightly to 25% of revenues, labor costs can come down significantly to 30%, and occupancy costs can also come down significantly to 25%.  

So the goal is set at $125mm in revenue from company-owned stores on current store count with the following cost breakdown:  


$mm

% of revenues

Revenue

125


Food Costs

31.25

25.00%

Labor

37.5

30.00%

Occupancy

31.25

25.00%


Gross Profit

25

20.00%

G&A

12.5

10.00%

EBITDA

12.5

10.00%


For comparison, Hearthstone generated 16% of economic EBITDA margin (grossed up for the franchise fee) in 2014, making our 10% EBITDA margins quite conservative.  Even our most aggressive best-case margin assumption of 12% is conservative relative to the Hearthstone TTM numbers.

Cash and Capitalization

One of the biggest issues facing turnaround candidate companies is cash flow.  Change costs money, and companies with negative cash flow are typically tight on cash.  While management has implemented many changes, there is still substantial work to be done in terms of improving and updating the look of the restaurants.  These improvements will cost money.  In 2014, the team successfully raised over $25mm in debt and equity capital.  As a result, the company had over $21mm in cash on the balance sheet as of year end.

  • On May 20, the company placed a $2.5mm note with AB Opportunity Fund and AB Value Partners.  

  • On August 19, COSI issued equity in a $4.5mm private placement transaction to Janus and an existing shareholder.

  • On December 12, the company completed a rights offering that raised $19.7mm from existing shareholders.

When we wrote our original thesis back last June, we believed that additional capital was needed for COSI to clean up its act outside Boston.  Clearly management agreed.

Hearthstone Acquisition

On April 1, 2015, COSI announced completion of the acquisition of RJ Dourney’s company, Hearthstone Associates.  The merger was originally discussed as part of his sign-on package.  The owners of Hearthstone (RJ, his wife, and CFO Richard Bagge) get a total of 1.79mm shares of COSI in exchange for Hearthstone, plus COSI assumes $10.7mm in Hearthstone debt.  

On April 10, the company raised $15.5mm of cash via an equity private placement.  The company used $4.7mm of the proceeds to pay down debt acquired in connection with the acquisition, for a net raise $10.8mm. We participated in this round.

We believe the acquisition serves to align RJ’s interests with shareholders, as RJ is trading his interest in a cashflow positive private company with a smaller share in a much riskier cashflow negative COSI corporate entity.  With 10 years experience with COSI as a franchisee and a long career in the chain / franchise restaurant industry, he is in a good position to evaluate the risks.  His decision was to take the opportunity. This gives us comfort with our long position. 

Balance Sheet

As of the 12/29/14 B/S, the company had $21.6mm in cash on the balance sheet and $6.6mm in debt.  In early April 2015, the acquisition of Hearthstone closed and the company raised over $15mm in new capital. Here is how we believe the balance sheet will look: 


Balance Sheet, $ in thousands

12/31/2013

9/29/2014

12/29/2014

Projected 3/31/15

Pro-Forma for Hearthstone & Equity Issuance

Cash

$6,021

$6,113

$21,560

$18,560

$29,327

A/R

$594

$799

$581

$581

$717

Inventories

$779

$768

$825

$825

$1,018

Other Current

$1,899

$1,005

$1,830

$1,830

$1,635

Total CA

$9,293

$8,685

$24,796

$21,796

$32,698


FFE

$8,195

$6,768

$7,308

$7,308

$9,021

Other LA

$1,115

$1,411

$1,327

$1,327

$1,327

Total LA

$9,310

$8,179

$8,635

$8,635

$10,348

Total Assets

$18,603

$16,864

$33,431

$30,431

$43,046


A/P

$2,462

$3,023

$1,519

$1,519

$1,875

Accrued Exp

$9,088

$6,591

$9,336

$9,336

$9,336

Current Portion

$214

$515

$195

$195

$0

Total SL

$11,764

$10,129

$11,050

$11,050

$11,211


Long-term Debt

$0

$6,154

$6,623

$6,623

$12,623

Deferred Franchise Revenue

$1,931

$1,966

$1,724

$1,724

$1,724

Other LL

$2,189

$1,530

$1,663

$1,663

$1,663

Total LL

$4,120

$9,650

$10,010

$10,010

$16,010


Common Stock

$181

$245

$383

$383

$383

APIC

$297,181

$303,571

$323,256

$323,256

$332,723

Treasury Stock

-$1,198

-$1,198

-$1,198

-$1,198

-$1,198

Retained Earnings

-$293,445

-$305,533

-$310,070

-$313,070

-$316,084

Total E

$2,719

-$2,915

$12,371

$9,371

$15,824

Total L+E

$18,603

$16,864

$33,431

$30,431

$43,045


Shares Out (mm)


38.4

38.4

47.8


Notably, there is cash available for the capital improvements we know are necessary.  

Valuation

Pulling it all together, we take our medium-term target numbers:

Restaurant Net Sales: $125mm

Gross profit margin: 20%

Gross Profit from Company-Owned Stores: $25mm

Franchise Revenue: $2.0mm ($2.8mm less $0.8mm from Hearthstone)

Total Gross Profit: $27mm

General & Administrative Expenses: $12.5mm

Projected EBITDA: $14.5mm

Competition’s EV/EBITDA multiples are at 11x for PNRA and 28x for CMG. If we use a conservative EV/EBITDA multiple of 10x, you get an EV of $145mm for the combined entity.  Total debt: $12.6mm      

Total Cash: $29.3mm

Market cap = EV - Debt + Cash: $161.7mm.  

NOL’s of $225mm: $44mm (Assuming 50% haircut to valuation)

Total Value: $206mm

Shares Outstanding 47.8mm   

Stock price of $4.30 with reasonable / conservative assumptions.  And that is without expanding store count at all.

Boundary Condition Valuation:

We have made some conservative assumptions.  Let’s now push it to the limit and see what the valuation looks like if RJ can get the rest of COSI to look exactly like Hearthstone in terms of AUV and EBITDA margin:

Restaurant Net Sales @ $1.75mm AUV: $135mm

EBITDA Margin: 12%

EBITDA from Company-Owned Stores: $16.2mm

Franchise Revenue @ $1.75mm AUV: $3.4mm

Total EBITDA: $19.5mm

EV @ 10x EV/EBITDA Ratio: $195mm

Total Debt: $12.6mm

Total Cash: $29.3mm

Market cap = EV - Debt + Cash: $212mm

NOL’s of $225mm (no haircut): $88mm

Total Value: $300mm

Shares Outstanding 47.8mm

Stock Price (incl. NOL’s): $6.27

So it is theoretically possible for the stock to get to $6.27 without any expansion of store count.

How Big Can Cosi Become?

Now let’s talk about growing store count.  This is the fun part of the analysis because we get a glimpse into the long-term potential for the company.

Now, the first priority for RJ and team is to get the current store base in order, and get to both the revenue and EBITDA margins goals we discuss above.  But in the long-term, there is huge potential for growth.  Cosi has 111 stores currently with a mix of 70% company-owned / 30% franchise post-Hearthstone acquisition.  Panera has 1810 locations with a mix of 50% company-owned stores and 50% franchise locations as of July 2014.  RJ believes there are about 2000 potential locations nationwide.  So long-term, with a profitable operating model at the store level, there is significant room for expansion in terms of store count.  

Even with 10x = 1110 total stores and the current 70/30 split between company-owned and franchise, the company could be worth a multiple of our projected numbers.  It is going to take time and capital to get there, but the team is already laying the groundwork for this type of success.

We think the Cosi team will focus on implementing the Boston processes throughout the organization over the next year. Once all of Cosi is ready to serve up an amazing experience, we believe RJ will press the pedal to the metal from a public relations and marketing standpoint.

Conclusion

As you can see, we believe there is tremendous opportunity in COSI if RJ and team can right the ship and get it headed in the correct direction.  Based on our meetings and discussions with management, we feel confident in their ability to do so.

We exercised our rights to purchase shares in the December rights offering, and we participated in the April 2015 deal.  

Of interest: New CEO Lights a Fire in the Ovens at Cosi 

Jennifer Galperin. Follow me on Twitter and Stocktwits.

Michael Bigger. Follow me on Twitter and StockTwits

Disclaimer: Bigger Capital and related entities are long a sizable position in COSI. COSI is in a turnaround mode and it is not suitable for the majority of investors. The likely outcome of an investment is a loss of principal. Take our opinions with a grain of salt. If you find yourself relying on our views to make an investment decision it means you definitely did not do your homework about this situation.

Wednesday
Apr152015

Plug Power Site Visit

On Monday, April 13, I joined a group of investors to tour Plug Power's ($PLUG) Latham facility as well as a nearby $PLUG customer's distribution center.  $PLUG CEO Andy Marsh rolled out the red carpet for us, including dinner in exotic Amsterdam, NY.  Aside from the beautiful red Ferrari parked outside the restaurant, there weren't too many surprises.  Some of my observations, in no particular order: 

  • The PLUG manufacturing facility seemed to really be rockin' and rollin'.  I tweeted a picture of several hundred GenDrive units ready to go to a big customer.  Now, I have visited Latham a few times.  The first time, in the spring of 2013, when the stock was trading for $0.12.  Back then, the facility had a totally different feel.  Now it feels much more alive.
  • At PLUG's facility, we saw new fueling stations being assembled, as well as parts for several more.  From Marsh down to the factory floor, there is focus on providing a soup-to-nuts solution for customers.  As Marsh said, this really is customer-driven and results in a much shorter sales cycle.
  • Marsh mentioned a focus on hydrogen infrastructure.  It is clear that proper infrastructure is critical and also a key cost driver for material handling customers.  What is significant is that by setting up proper infrastructure, $PLUG is setting itself up to be at the epicenter of the hydrogen universe.  As the popularity of hydrogen power increases, $PLUG's infrastructure will allow the addressable market to grow.
  • Marsh seems really focused on connecting with investors and increasing transparency.  He is keenly aware of criticisms, particularly those focused on meeting (or exceeding) guidance.  The current revenue guidance numbers reflect his desire to increase PLUG's credibility in that area. 
  • We talked about how the sales process has transitioned with some customers to more of a planning process where there is longer-term clarity.  Andy seems very bullish on PLUG's ability to move additional big customers to this type of sales process.   
  • We talked about gross margins.  I believe it is important to show (preferably soon) that PLUG can make solid profits in material handling on a gross basis.  Additional applications such as tuggers, refrigerated trucks, etc. are nice but not if the core business is marginal on a gross basis.  To this point, we saw a few design innovations on the factory floor that are aimed at cutting costs.  In addition, the recent acquisition of ReliOn provides a bit of supplier diversity and sheer volumes drive costs down.  All told, Marsh seems pretty confident in PLUG's ability to make good money in material handling.  Of course, I want to see the numbers!
  • The biggest surprise for me at the customer site visit was the impact of taking out the battery room.  A huge room was left vacant.  This customer chose to use a small part of it as the PLUG GenDrive maintenance area.  But it was clear the space was too big, as they had only one unit in for service (out of almost 300 onsite) and 2 full-time workers to perform the service.  Clearly there is room to both improve space utilization as well as cut costs in the servicing. 

We did get a chance to meet the new CFO, Paul Middleton.  Middleton seems focused on understanding the key drivers to the business, both costs and revenues.  He has the ability to simplify the complex, which will be helpful to investors.  He is still new to the company, so I didn't ask any detailed questions in our brief conversation.  I will save that for another time.

Of Interest: The Boulevard of Broken Dreams: Plug Power

Jennifer Galperin. Follow me on Twitter and Stocktwits.

Wednesday
Mar252015

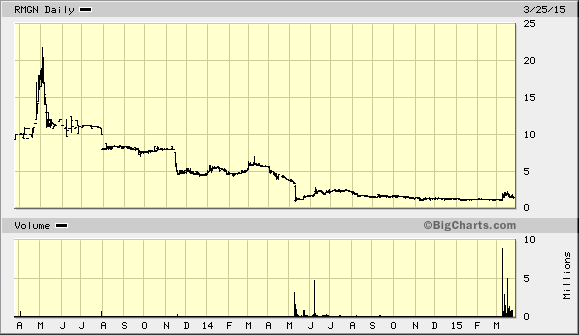
RMG Networks Investment Thesis


Stock Price: $1.50 (Deal Price $1)

Shares Outstanding (Assuming Conversion): 37.2mm

Market Cap: $56mm

Debt: $2.2mm

Cash: $14.7mm + $5.5mm for Media Biz

EV: $38mm (includes $5.5mm for the sales of the media business and no allocation for Q4 and Q1 cash burn)

Sales: About $62mm on a TTM basis. $46 mm not including media business.


Summary

  • Stock price down about 90% in about 18 months.  

  • Impressive customer list including 70 of the Fortune 100 and about half of the S&P500.

  • New, experienced, motivated CEO.

  • Earnings Power = 15% EBITDA margin

  • Debt significantly reduced due to recent equity financing.


Investment Thesis

RMG Networks (RMGN) operates in two distinct segments, Media and Enterprise Software .  In Media, they focus on the airline seatback content delivery space.  In Enterprise Software, RMG provides video tools for production analytics and internal communications for corporate uses in 5 distinct sectors.  RMG’s impressive Enterprise Software customer list includes 70 of the Fortune 100 companies, and about 70 percent of the S&P 500.  

Roth Capital Partners recently introduced us to Bob Michelson, the President and CEO of RMG Networks. Michelson took over as CEO in the summer of 2014.  He has a background in operations and strategy for Sterling Capital Partners, and came on board to return the company to profitability and growth.  As an aside, we know Sterling from a previous investment in Select Comfort (SCSS) in 2009. We rode SCSS from $.90 to $24 in just a few years (Article). Needless to say, we are impressed by how Sterling transformed SCSS. Michelson could transform RMGN into a real winner for us.

Michelson quickly identified several issues that he believes contributed to the company’s losses.  For each, he devised a solution that could be implemented quickly.  

First, he feels the Enterprise Software division lacks focus.  He identified 3 of the 5 operating sectors to focus on, and essentially eliminated the remaining 2 non-core sectors.  Michelson  will focus on 1) Supply Chain,  2) Call Centers, and 3) Internal Communications.  He eliminated the Retail and Hospitality sectors, although he plans to continue to service existing customers in these areas.  

Second, Michelson felt RMG had not delivered innovation to its customers which degraded the salesforce narrative.  Specifically, RMG had introduced zero new products to the market in 3 years.  He challenged the company to roll out 6 new products in 6 months, by generalizing some of their best one-time customer solutions.  To date he has rolled out 3 products in 3 months, including software to facilitate office hoteling.

His other turnaround solutions included rethinking the global expansion strategy, developing a new marketing strategy focusing on the value proposition of the key products, and improving the sales leadership structure. In addition, on March 19th, RMG disclosed that it signed a non-binding letter of intent to sell its media business for $5.5mm.

Strategically, RMG is moving Enterprise Software more towards a Software-As-A-Service (SAAS) model and away from the traditional licence purchase model.  While revenues may experience a decline during the transition, we feel the move will improve the sales experience and provide more smooth, consistent revenues for RMG.

In 2014, the company recorded total revenues of $61.8mm (including $14.8mm from the media business). RMG plans to be cashflow positive by the third quarter of 2015 through implementation of the turnaround initiatives.  According to Michelson, the supply chain business has the most near-term opportunity for revenue growth.  That business line generated less than $1mm of the total 2014 revenue, but the current pipeline in this channel is $8mm and the potential for this market is in the range of $50mm / year medium-term.  

If Michelson and team can successfully execute on his turnaround initiatives, a rough income statement looks something like this on an annual basis, medium-term (2-3 years out):

Revenue: $100mm ($50mm current from call centers + $50mm potential from supply chain)

EBITDA: $15mm (15% margin) (source: management)

EV @ 10x EBITDA: $150mm

Debt: $0

NOL’s Valued at: $10mm ($30mm of NOL’s valued conservatively at $10mm)

Total Value: $160mm

Shares Out: 37.2mm

Share Price: $4.30

If Michelson and team can increase call center revenues beyond the 2014 numbers, there is additional upside in our projections.  

On March 9, RMG announced that it expects sequential adjusted revenue growth to exceed 30% in the fourth quarter with stable adjusted gross margin and improved adjusted EBITDA. Michelson is already making a big impact.

On March 25, the company announced a new financing which goes a long way in shoring up RMG’s balance sheet and eliminating its debt.  We are happy to participate in the deal.

Overall, we are very excited about the opportunity to invest in a cheap company with an impressive client list including 70% of the Fortune 100.  We think there is tremendous upside potential.  While there is downside risk, we think the stock price is at a level where the risk / reward analysis is quite favorable.

Written by Jennifer Galperin and Michael Bigger.

Disclaimer: Bigger Capital and Bachelier, LLC are participating in the preferred shares transaction. RMGN is a highly distressed situation and it is not suitable for the majority of investors. The likely outcome of an investment is a loss of principal. In other words, the probability of losing all your investment in this situation is very high. 

Friday
Jan232015

BIGGER CAPITAL WARNS AGAINST STANDARD GENERAL CONFLICTS OF INTEREST AT AMERICAN APPAREL

BIGGER CAPITAL WARNS AGAINST STANDARD GENERAL CONFLICTS OF INTEREST AT AMERICAN APPAREL

Notes That As a Result Of Interest Payments In Stock, Possible Charney Default And Lender Status, Standard General Has Every Incentive To Hold Out On a Sale Of The Company

Cautions against Standard General-Dominated Board Failing to Capitalize on Acquisition Interest in American Apparel Contrary to the Best Interests of ALL Shareholders

New York, NY – January 23, 2015 – Bigger Capital Fund, LP, Bachelier, LLC and the Bigger Family, significant shareholders since 2011 of American Apparel, Inc. (NYSE: APP) (“American Apparel” or the “Company”), today announced that they have delivered a letter to American Apparel’s Board of Directors.  The full text of the letter is included below: 


January 23, 2015

Board of Directors

American Apparel, Inc.

747 Warehouse Street

Los Angeles, California 90021

Dear Members of the Board of American Apparel:

The Bigger Capital Fund, LP, Bachelier, LLC and the Bigger Family (together, “Bigger Capital”) is a significant shareholder of American Apparel, Inc. (NYSE: APP) (“American Apparel” or the “Company”).  We are a long-term investor in the Company and we have followed closely and with great concern the haphazard developments at American Apparel over the past years  and the loss of value that has resulted from them.  We write to you today to register our grave concerns over the serious conflicts of interest between Standard General L.P. (“Standard General”) on the one hand, and the rest of the American Apparel shareholders, on the other, which given Standard General’s de facto control in the boardroom may cause the Company’s Board of Directors (the “Board”) to make decisions that are contrary to the best interests of all American Apparel shareholders. 

In July, Standard General negotiated the right to replace five of the seven directors on the Board with three of its own designees and two designees mutually agreed upon by Standard General and the Company under a Nomination, Standstill and Support Agreement, dated as of July 9, 2014, between Standard General, Dov Charney and the Company (the “Agreement”).  This Board composition arrangement gives disproportionate power to Standard General and for all practical purposes, effective control over critical decisions for the Company and all its shareholders.

Moreover, according to public filings, Standard General owns 1,540,000 shares of American Apparel and has a security interest in an additional 74,560,813 shares owned by Dov Charney pursuant to their agreement dated June 25, 2014 (the “Charney Agreement”).  Under the Charney Agreement, Standard General purchased 27,351,407 shares of American Apparel and then sold them to Mr. Charney after providing him with a loan to purchase such shares, which bears an interest rate at 10% per annum, payable to Standard General in American Apparel shares.

In short, the Charney Agreement is structured so that with the passage of time, Standard General’s ownership position increases from the interest payments in shares and in the event of a default by Dov Charney, Standard General will become entitled to receive another sizable chunk of American Apparel shares pledged under the Charney Agreement.  Given Mr. Charney’s recent comments in the media that he is down to his last $100,000 a default appear quite possible if not likely.  As a result, the Charney Agreement creates every incentive for Standard General to resist any sale of the Company regardless of the price offered at least until Standard General has collected the full benefits of its deal with Dov Charney.  Needless to say, it does not appear that Standard General will be a very motivated seller.

While Standard General has no interest to sell out, not so for the rest of American Apparel’s embattled shareholders.  Most of us who have remained invested in the stock over the long-term have seen our stakes diminish dramatically in value with the tumultuous events over the past year or so.  Uncertainty about the Company’s leadership and strategic direction as well as questions about American Apparel’s prospects as a standalone business have significantly depressed the Company’s stock price.  This undervaluation has made American Apparel a very attractive acquisition target.  For example, as reported on December 18, 2014, Irving Place Capital approached American Apparel regarding a potential transaction valuing the Company at as much as $1.40 per share, a 103% premium from the previous day’s closing price of $0.69, causing American Apparel shares to soar nearly 45%.  We believe other interested potential acquirors may emerge as well.  It is clear to us, that the timing is right to capitalize on the acquisition interest in American Apparel and pursue a value-maximizing transaction to unlock value for shareholders.

Not only are the interests of Standard General in conflict with those of the other shareholders in terms of the upside to a prompt sale of the Company, but also Standard General does not face the same downside from missing value-maximizing opportunities as other shareholder do.  Standard General is also a lender to the Company. On July 16, 2014, Lion/Hollywood L.L.C. (“Lion”) assigned its rights and obligations as a lender under its Credit Agreement, dated as of May 22, 2013 with the Company to Standard General. As disclosed in the Company’s Quarterly Report filed on November 10, 2014, nearly $9.9 million was outstanding under the Credit Agreement as of September 30, 2014.  This means that even if the stock were to become worthless, Standard General will have the right to be repaid its loan in any liquidation or similar proceeding.  This effectively caps Standard General’s downside risk from the loss of value of American Apparel’s stock.

These conflicting interests between Standard General and the other American Apparel shareholders put the Standard General-dominated Board in a delicate position but with only one responsible course of action.  The Standard General-dominated Board must comply with its fiduciary duty to serve the bests interests of all shareholders and must resist the temptation to do what is best for Standard General alone to the detriment of other shareholders.  The coming days will be the true test to the Board’s fulfillment of its duties.

We will also closely monitor Standard General for any attempt to inappropriately interfere with the governance of American Apparel to extract unique benefits for itself that other shareholders do not share.  As a de facto controlling shareholder, Standard General, too, has important duties and responsibilities to the minority shareholders.  Bigger Capital has every intention of remaining alert and focused on the actions of the American Apparel’s Board, Standard General and its representatives on the Board and will consider all actions it deems necessary to protect the interests of the minority shareholders of American Apparel.

Sincerely,


Michael Bigger

Bigger Capital Fund, LP

Bachelier, LLC

631-987-0235 

Wednesday
Jan072015

Investment Thesis: COSI


Price: $2

Enterprise Value: $63mm

Debt: $6.1mm

Cash: $23mm

EBITDA: -$12MM


Summary

●     We project $15.3mm in EBITDA based on improved revenues and gross margins. 

●     We believe COSI has medium-term upside to $5.10 with our best case-case scenario calling for a stock price of $7.28 using the Hearthstone metrics for the overall system. 


Background

We have been closely following Cosi ($COSI) since RJ Dourney took over as CEO in March of 2014. Dourney is a successful COSI franchisee, making profits at 13 locations in and around Boston. This is quite an accomplishment since COSI has accumulated more than $300mm in net negative earnings over its lifetime, a testimony to poor management of the parent company over that time period.

I first spoke to RJ back in June and in one conversation, I had confidence that he is the right guy to turn around COSI’s fortunes.  After we met him and his team and toured some of his Boston locations on August 20, it became clear to us that RJ has a formula for success in the fast casual arena.  His locations are clean, efficient, and profitable.

RJ Dourney began his relationship with COSI as a franchisee in 2005.  At that time he chose COSI because he believed there is a unique brand essence, with fresh baked bread and healthy menu options.  He and his corporate entity, Hearthstone, opened 5 stores in Boston and grew to 13 locations by 2014.  All of the Hearthstone locations are operating successfully and profitably.  In March of last year, Dourney became the new CEO of the company.

Dourney is wasting no time integrating his successful strategy into the company-owned locations. He mixes together fresh ingredients, clean and organized locations, and an efficient labor force to bake up profits. Long-term, if RJ and team are successful, COSI’s growth trajectory could match the growth of Chipotle ($CMG) and Panera ($PNRA).  This situation has strong potential.

RJ hit the ground running with his turnaround plan for COSI corporate.  In just a few short months, he hired a new VP of HR, an operations expert, and an  IT manager.  He began to implement the operating system from the Boston locations across the company-owned stores.  He is reviewing the culinary component and is happy with the results so far.  He moved the corporate office from a 27,000 sqft facility outside of Chicago to a 6,000 sqft facility near Boston.  He hired HILCO to help the company get out of some of it’s bad leases.

RJ’s formula for operational success at COSI involves cleaning up the stores, increasing labor efficiency, and making the brand more current in line with the Boston model. 

Market

Cosi operates in the fast casual dining market. This is a great space for two reasons.  First, fast casual is a growing area filling the void between low-quality fast food and higher quality restaurants that require a full hour for lunch.  At Cosi (and competitors Panera and Chipolte, to name a few), customers can get a delicious lunch in just a few minutes. Second, Americans are moving toward high-quality, healthy food. Cosi makes all its bread in-store, which means the bread contains simple ingredients and tastes fresh.  Most people could eat at Cosi almost 5 days a week due to the large variety of healthy menu options.  Check out this video to see what we mean: youtu.be/-A0eG0s2x9Q. 

Anecdotally, Cosi recently rolled out a more high-quality chicken product along with with a price increase to cover the cost. RJ said that not one single customer complained about the higher price.  They noticed it, but are more than willing to pay for the uptick in quality.  So clearly there is a need for high quality, fast, healthy food. 

So, we establish that Cosi has a great brand with a great management team in place and a business model that is proven in Boston. 

Financials

COSI currently has 66 company-owned locations (58%) and 47 franchises locations, for a total of 113 restaurants.  Here is a breakdown of revenues and costs for the company-owned stores during the first half of 2014:

COSI 1H2014:


$mm

% of revenues

Revenue

38


Food Costs

9.5

25.00%

Labor

14.5

38.16%

Occupancy

14

36.84%


Gross Profit

0.00

0.00%


Compare that to Chipotle and Panera 1H2014:


CMG


PNRA


$mm

% of revenues


$mm

% of revenues

Revenue

1954


1091


Food Costs

675

34.54%


302

27.68%

Labor

436

22.31%


298

27.31%

Occupancy

321

16.43%


227

20.81%


Gross Profit

522

26.71%


264

24.20%

A quick glance of the numbers shows you that Cosi's Labor and Occupancy costs are significantly above that of the competition, while food costs are significantly below.  RJ and team are focused on increasing labor efficiency as a critical piece of their turnaround strategy.  If they can get labor costs down to 30%, the picture looks like this:

COSI Target Labor Costs:


$mm

% of revenues

Revenue

38


Food Costs

9.5

25.00%

Labor

11.4

30.00%

Occupancy

14

36.84%


Gross Profit

3.10

8.16%

Now let's talk about Occupancy costs.  COSI is spending 35% of revenues on occupancy costs, this should be closer to 25%.  Now, occupancy costs are at least partially a fixed cost, so the problem can be broken out into (a) revenues per restaurant are too low, and (b) lease costs are too high.  RJ and team are clearly aware of both issues.  Let's start with revenues. 

COSI operates 63 restaurants and has an additional 47 franchise restaurants.  If RJ and team can successfully bring the Hearthstone (RJ’s corporate entity) AUV numbers to the entire organization, AUV would go from $1.1mm to $1.75mm system-wide.  That means $110mm in annual top-line revenues, plus another $4.1mm in franchise revenue, for a total of $114mm in revenues.  This is a 48% increase over the $77mm in annualized revenue based on the nine months ended September of this year.  Even if AUV increases to $1.6mm / store, that means $100mm in annualized revenues.

Now, to address (b), they hired a real estate workout company to help them terminate and / or renegotiate some leases and there is likely some wiggle room.  Between increasing revenues per store and renegotiating leases, management believes a long-term run rate for occupancy cost should be closer to 25% of revenues:


COSI Target Occupancy Costs


$mm

% of revenues

Revenue

100


Food Costs

25

25.00%

Labor

30

30.00%

Occupancy

25

25.00%


Gross Profit

20

20.00%

G&A

10

10.00%

EBITDA

10

10.00%


Now, how does this compare to the numbers Hearthstone is generating?  According to the Hearthstone numbers disclosed in the S-1 for the rights offering:

Hearthstone financials, $mm

$mm


9mo through 9/30/2014

12mo through 12/31/2013

Revenue


$12.6

$16.6

EBITDA


$0.5

$0.9

Franchise Fees

6%

$0.76

$1.0

Pre-Opening Expenses


$0.08


Legal Fees


$0.065


Pro Forma Contribution to Company EBITDA, 13 Stores


$1.4

$1.9

EBITDA Margin


11%

12%


So 11% to 12% EBITDA margin is where RJ is with Hearthstone.  Our target of 10% EBITDA margin for COSI corporate is reasonable.

When Dourney took over Au Bon pain in 2000 the AUV was $1.1mm and 5 years later it reached $1.7million. We expect a similar trajectory for current Cosi restaurants.

Additional Metrics

Here are some metrics that management has shared with our group. The High Street Boston location has an average peak transaction of 500 transactions an hour compared to 300 for the whole Hearthstone. The rest of COSI does a peak of 185-200 transactions an hour. A rock and rolling Chipotle peaks of 260 transactions per hour.

The Hearthstone average unit volume (AUV) is $1.75mm a year. the rest of COSI does $1.1mm.

The industry average employee turnover is 150% while Hearthstone has a turnover of 38%. The industry average management turnover is 35% while the Hearthstone turnover is 11%.

Cash and Capitalization

One of the biggest issues facing turnaround candidate companies is cash flow.  Change costs money, and companies with negative cash flow are typically tight on cash.  RJ views these capital expenditures as an investment in the future of the company, but he needed to get capital from somewhere.  In 2014, the team (led by CFO Scott Carlock) successfully raised over $25mm in debt and equity capital. 

●     On May 20, the company placed a $2.5mm note with AB Opportunity Fund and AB Value Partners. 

●     On August 19, COSI issued equity in a $4.5mm private placement transaction to Janus and an existing shareholder.

●     On December 12, the company completed a rights offering that raised $19.7mm from existing shareholders.

When we wrote our original thesis we believed that sufficient capital was needed for COSI to clean up its act outside Boston.  Clearly management agreed.

Balance Sheet

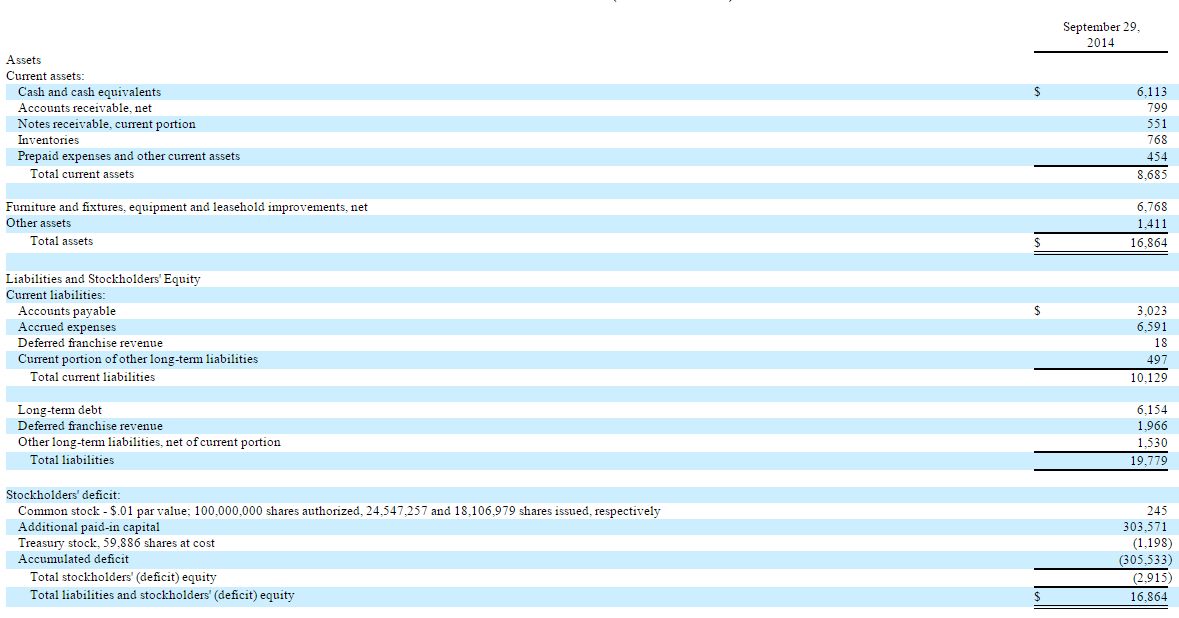
As of the 9/30/14 B/S, the company had $6.1mm in cash on the balance sheet and $6.1mm in debt.  Given proceeds of $20mm from the rights offering and an estimated quarterly cash burn of $3mm, they should have about $23mm in cash on the balance sheet at year end.  Here is the 9/30 balance sheet.


As of 12/31/14, the company will have another $20mm in cash from the rights offering, less cash burn of about $3mm.  We project the balance sheet will look something like this:


Balance Sheet, $mm

12/31/2013

9/29/2014

Projected 12/31/14

Projected 3/31/15 With Hearthstone

Cash

$6,021

$6,113

$23,113

$20,113

A/R

$594

$799

$799

$799

Inventories

$779

$768

$768

$768

Other Current

$1,899

$1,005

$1,005

$1,005

Total CA

$9,293

$8,685

$25,685

$22,685


FFE

$8,195

$6,768

$6,768

$10,226

Other LA

$1,115

$1,411

$1,411

$2,808

Total LA

$9,310

$8,179

$8,179

$13,034

Total Assets

$18,603

$16,864

$33,864

$35,719


A/P

$2,462

$3,023

$3,023

$3,023

Accrued Exp

$9,088

$6,591

$6,591

$6,591

Current Portion

$214

$515

$515

$515

Total SL

$11,764

$10,129

$10,129

$10,129


Long-term Debt

$0

$6,154

$6,154

$16,575

Deferred Franchise Revenue

$1,931

$1,966

$1,966

$1,966

Other LL

$2,189

$1,530

$1,530

$1,530

Total LL

$4,120

$9,650

$9,650

$20,071


Common Stock

$181

$245

$245

$245

APIC

$297,181

$303,571

$323,571

$323,571

Treasury Stock

-$1,198

-$1,198

-$1,198

-$1,198

Retained Earnings

-$293,445

-$305,533

-$308,533

-$317,099

Total E

$2,719

-$2,915

$14,085

$5,519

Total L+E

$18,603

$16,864

$33,864

$35,719


Notably, there is ample cash available for the capital improvements we know are necessary. 

Hearthstone Acquisition

As part of the deal to sign RJ as CEO of COSI, an acquisition of Hearthstone was contemplated.  The acquisition terms say that RJ gets 1.79mm shares of COSI in exchange for Hearthstone, plus RJ transfers anywhere between $6.9mm and $9.2mm in debt (depending on which paragraph of the S-1 you read).  Hearthstone has book assets of $4.85mm.  Total forecasted EBITDA of $2.3mm (pro forma for consolidation and 2 new restaurants). 

To value Hearthstone, we use EV / EBITDA ratios. PNRA trades at 11x and others are around 10-15.  We take a haircut to those valuations and use 7x $2.3mm EBITDA = $16mm EV.  Let's say $10mm in debt, which means the equity is valued at $6mm.  That corresponds to a “purchase” price for RJ of $3.40 / share.  In addition, RJ will receive both time-based and performance-based shares.  The time-based component consists of a total of 414,582 shares, 25% at each anniversary of his start date.  The performance-based component consists of 414,582 shares, 25% at each of $2, $2.50, $3, and $4 share prices.


We believe the deal serves to align RJ’s interests with shareholders, as RJ is trading his interest in a cashflow positive private company with a smaller share in a much riskier cashflow negative COSI corporate entity.  With 10 years experience with COSI as a franchisee and a long career in the chain / franchise restaurant industry, he is in a good position to evaluate the risks.  His decision was to take the opportunity.  This gives us comfort with our long position.


Valuation

Pulling it all together, we take our projected numbers:

Restaurant Net Sales: $100mm
Gross profit margin: 20%
Net Profit from Company-Owned Stores: $20mm
Franchise Revenue: $3.0mm ($3.8mm less $0.8mm from Hearthstone)
Total Gross Profit: $23mm
General & Administrative Expenses: $10mm
EBIT: $13mm
Corporate EBITDA: $13mm
Hearthstone EBITDA: $2.3mm
Total Projected EBITDA: $15.3mm


Competition’s EV/EBITDA multiples are at 11x for PNRA and 28x for CMG.

EV/EBITDA multiple: 10x
EV: $153mm
Total debt (corporate): $6.1mm
Hearthstone debt: $10mm
Total debt: $16.1mm
Total Cash: $23mm
Market cap = EV - Debt + Cash: $160mm.
NOL’s of $225mm: $44mm (Assuming 50% haircut to valuation)
Total Value: $204mm
Shares Outstanding: 40mm


Stock price of $5.10 with reasonable / conservative assumptions.  And that is without expanding store count at all.

Boundary Condition Valuation:

We have made some conservative assumptions.  Let’s now push it to the limit and see what the valuation looks like if RJ can get the rest of COSI to look exactly like Hearthstone in terms of AUV and EBITDA margin:

Restaurant Net Sales @ $1.75mm AUV: $110mm
EBITDA Margin: 12%
EBITDA from Company-Owned Stores: $13.2mm
Franchise Revenue @ $1.75mm AUV: $4.1mm
Hearthstone Contribution: $2.3mm
Total EBITDA: $19.6mm
EV @ 10x EV/EBITDA Ratio: $196mm
Total Debt (incl. Hearthstone): $16.1mm
Total Cash: $23mm
Market cap = EV - Debt + Cash: $203mm
NOL’s of $225mm (no haircut): $88mm
Total Value: $291mm
Shares Outstanding: 40mm
Stock Price (incl. NOL’s): $7.28


So it is theoretically possible for the stock to get to $7.28 without any expansion of store count.                                                               

How Big Can Cosi Become?

Now let’s talk about growing store count.  This is the fun part of the analysis because we get a glimpse into the long-term potential for the company.

Now, the first priority for RJ and team is to get the current store base in order, and get to both the revenue and EBITDA margins goals we discuss above.  But in the long-term, there is huge potential for growth.  Cosi has 113 stores currently with a mix of 60% company-owned / 40% franchise.  Panera has 1810 locations with a mix of 50% company-owned stores and 50% franchise locations as of July 2014.  RJ believes there are about 2000 potential locations nationwide.  So long-term, with a profitable operating model at the store level, there is significant room for expansion in terms of store count. 

Even with 5 x = 1130 total stores and the current 60/40 split between company-owned and franchise, the company could be worth multiple of our projected numbers.  It is going to take time and capital to get there, but the team is already laying the groundwork for this type of success.

We think the Cosi team will focus on implementing the Boston processes throughout the organization over the next year. Once all of Cosi is ready to serve up an amazing experience, we believe RJ will press the pedal to the metal from a public relations and marketing standpoint.

Conclusion

As you can see, we believe there is tremendous opportunity in COSI if RJ and team can right the ship and get it headed in the correct direction.  Based on our meetings, we feel confident in their ability to do so.

We have exercised our rights to purchase shares in the December rights offering.  In addition, we plan to increase our position opportunistically.

Tuesday
Jan062015

Abandon Your Intuition

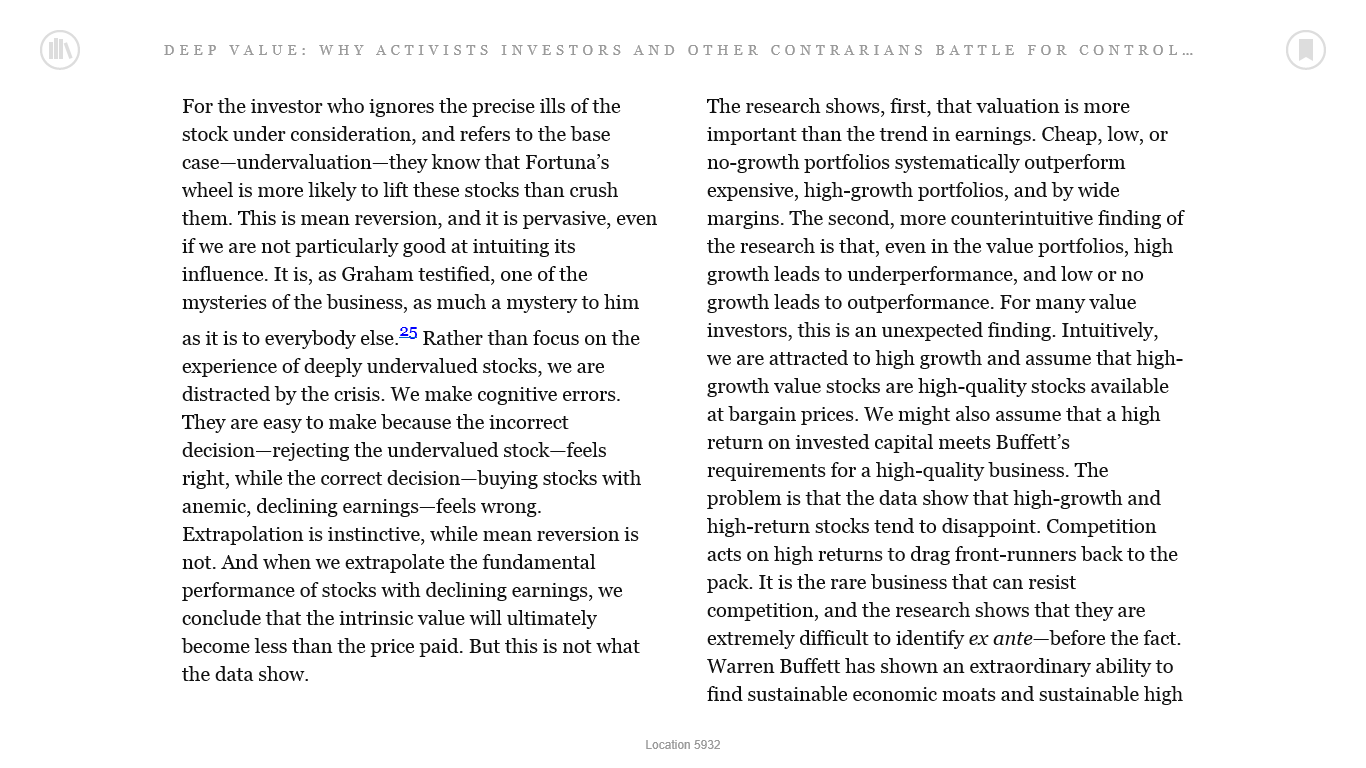
I am reading Deep Value: Why Activist Investors and Other Contrarians Battle for Control of Losing Corporations by Tobias E. Carlisle (Amazon Link). I came across this passage that I want to share with you. Enjoy!
 
Tobias Carlisle granted permission to Michael Bigger to publish this excerpt (click image to enlarge):
Friday
Dec262014

American Apparel Books and Records Request

Page 1 ... 2 3 4 5 6 ... 18 Next 10 Entries »